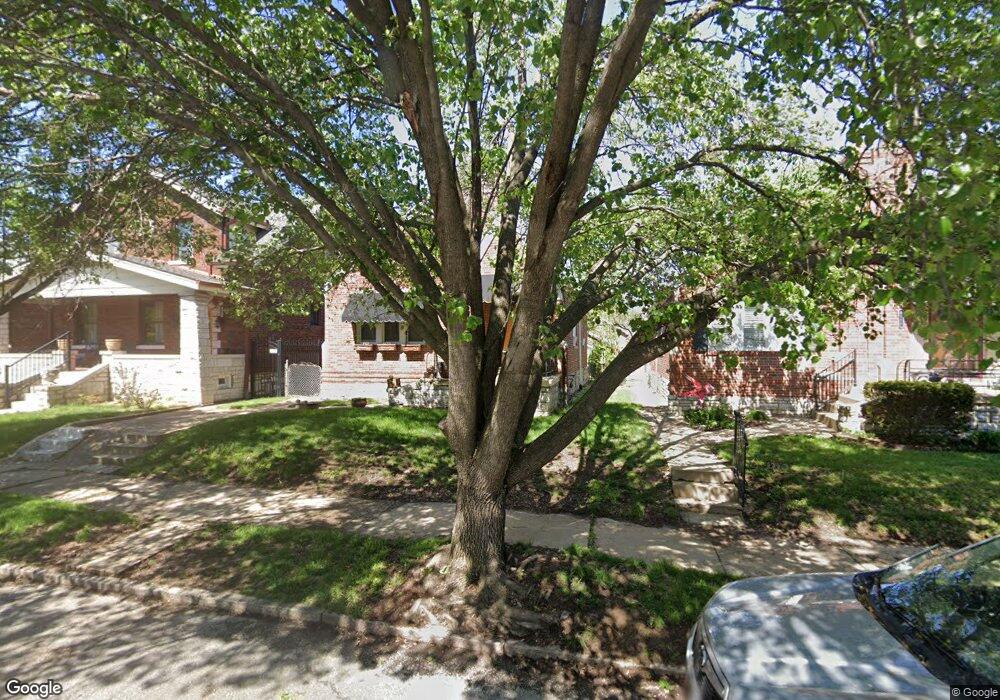
4121 Federer St Saint Louis, MO 63116
Bevo Mill NeighborhoodEstimated Value: $221,000 - $246,000
Studio
1
Bath
2,208
Sq Ft
$104/Sq Ft
Est. Value
About This Home
This home is located at 4121 Federer St, Saint Louis, MO 63116 and is currently estimated at $229,870, approximately $104 per square foot. 4121 Federer St is a home located in St. Louis City with nearby schools including Woerner Elementary School, Long International Middle School, and Roosevelt High School.
Ownership History
Date
Name
Owned For
Owner Type
Purchase Details
Closed on
Feb 2, 2007
Sold by
Simbeck Jeffrey R
Bought by
Simbeck Jeffrey R and Giunta Robby Lee
Current Estimated Value
Home Financials for this Owner
Home Financials are based on the most recent Mortgage that was taken out on this home.
Original Mortgage
$152,859
Outstanding Balance
$92,013
Interest Rate
6.25%
Mortgage Type
FHA
Estimated Equity
$137,857
Purchase Details
Closed on
Jan 31, 2007
Sold by
Callaway Jason and Callaway Jenny Marie
Bought by
Simbeck Jeffrey R
Home Financials for this Owner
Home Financials are based on the most recent Mortgage that was taken out on this home.
Original Mortgage
$152,859
Outstanding Balance
$92,013
Interest Rate
6.25%
Mortgage Type
FHA
Estimated Equity
$137,857
Purchase Details
Closed on
Feb 3, 1999
Sold by
Niebling Mary Joan E
Bought by
Niebling Mary Joan E and Niebling Dorothy Marie
Purchase Details
Closed on
Jan 28, 1999
Sold by
Anselm Erina C
Bought by
Niebling Mary Joan E
Create a Home Valuation Report for This Property
The Home Valuation Report is an in-depth analysis detailing your home's value as well as a comparison with similar homes in the area
Home Values in the Area
Average Home Value in this Area
Purchase History
| Date | Buyer | Sale Price | Title Company |
|---|---|---|---|
| Simbeck Jeffrey R | -- | None Available | |
| Simbeck Jeffrey R | -- | None Available | |
| Niebling Mary Joan E | -- | -- | |
| Niebling Mary Joan E | -- | Capital Title |
Source: Public Records
Mortgage History
| Date | Status | Borrower | Loan Amount |
|---|---|---|---|
| Open | Simbeck Jeffrey R | $152,859 |
Source: Public Records
Tax History
| Year | Tax Paid | Tax Assessment Tax Assessment Total Assessment is a certain percentage of the fair market value that is determined by local assessors to be the total taxable value of land and additions on the property. | Land | Improvement |
|---|---|---|---|---|
| 2025 | $3,097 | $38,960 | $3,000 | $35,960 |
| 2024 | $2,956 | $34,270 | $3,000 | $31,270 |
| 2023 | $2,956 | $34,270 | $3,000 | $31,270 |
| 2022 | $2,763 | $30,670 | $3,000 | $27,670 |
| 2021 | $2,560 | $30,670 | $3,000 | $27,670 |
| 2020 | $2,334 | $28,160 | $3,000 | $25,160 |
| 2019 | $2,326 | $28,160 | $3,000 | $25,160 |
| 2018 | $2,173 | $25,480 | $2,660 | $22,820 |
| 2017 | $2,137 | $25,480 | $2,660 | $22,820 |
| 2016 | $1,957 | $23,010 | $2,660 | $20,350 |
| 2015 | $1,774 | $23,010 | $2,660 | $20,350 |
| 2014 | $1,727 | $23,010 | $2,660 | $20,350 |
| 2013 | -- | $22,400 | $2,660 | $19,740 |
Source: Public Records
Map
Nearby Homes
- 6135 Newport Ave
- 6136 Adkins Ave
- 4301 Holly Hills Blvd
- 4141 Bowen St
- 6149 Marwinette Ave
- 6021 Leona St
- 4076 Wilmington Ave
- 4068 Wilmington Ave
- 4317 Alma Ave
- 6112 Wanda Ave
- 6623 Leona St
- 4140 Burgen Ave
- 6462 Wanda Ave
- 6065 Wanda Ave
- 6049 Wanda Ave
- 5654 Leona St
- 4153 Loughborough Ave
- 4126 Bates St
- 6409 Myrlette Ct
- 3865 Bowen St
Your Personal Tour Guide
Ask me questions while you tour the home.