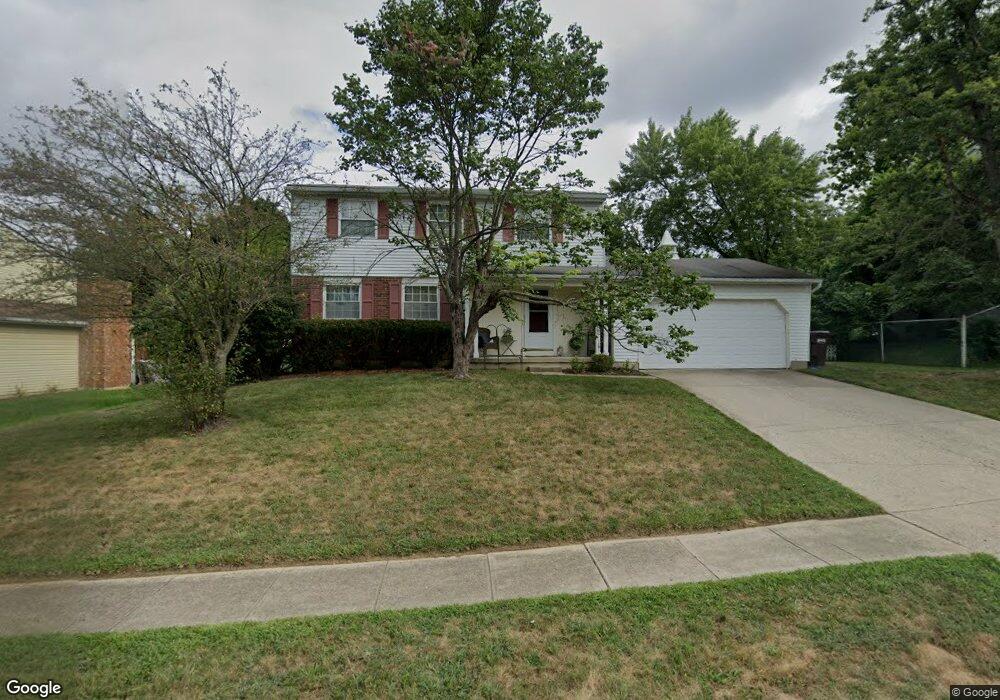
4121 Honeybrook Ave Dayton, OH 45415
Estimated Value: $254,000 - $267,000
4
Beds
3
Baths
2,080
Sq Ft
$125/Sq Ft
Est. Value
About This Home
This home is located at 4121 Honeybrook Ave, Dayton, OH 45415 and is currently estimated at $260,333, approximately $125 per square foot. 4121 Honeybrook Ave is a home located in Montgomery County with nearby schools including Northwood Elementary School, Northmont High School, and Trotwood Preparatory & Fitness Academy.
Ownership History
Date
Name
Owned For
Owner Type
Purchase Details
Closed on
Feb 21, 2024
Sold by
Rex Resid Property Owner V Llc
Bought by
Vinebrook Homes Borrower 2 Llc
Current Estimated Value
Home Financials for this Owner
Home Financials are based on the most recent Mortgage that was taken out on this home.
Original Mortgage
$403,660,000
Outstanding Balance
$271,200,674
Interest Rate
6.77%
Mortgage Type
New Conventional
Estimated Equity
-$270,940,341
Purchase Details
Closed on
Dec 5, 2016
Sold by
Rex Residential Property Owner A Llc
Bought by
Rex Residential Property Owner V Llc
Home Financials for this Owner
Home Financials are based on the most recent Mortgage that was taken out on this home.
Original Mortgage
$14,494,200
Interest Rate
3.57%
Mortgage Type
Future Advance Clause Open End Mortgage
Purchase Details
Closed on
Aug 4, 2016
Sold by
Rex Residential Property Owner Llc
Bought by
Rex Residential Property Owner A Llc
Home Financials for this Owner
Home Financials are based on the most recent Mortgage that was taken out on this home.
Original Mortgage
$20,000,000
Interest Rate
3.45%
Mortgage Type
Future Advance Clause Open End Mortgage
Purchase Details
Closed on
Mar 16, 2016
Sold by
Miller Thomas W and Miller Lori L
Bought by
Rex Residential Property Owner Llc
Purchase Details
Closed on
Jun 27, 2008
Sold by
Hild Nikki A and Hild Michael L
Bought by
Miller Thomas W and Reiber Lori L
Home Financials for this Owner
Home Financials are based on the most recent Mortgage that was taken out on this home.
Original Mortgage
$148,821
Interest Rate
6.1%
Mortgage Type
FHA
Purchase Details
Closed on
Feb 26, 2008
Sold by
Deutsche Bank National Trust Co
Bought by
Hild Nikki A
Purchase Details
Closed on
Sep 7, 2007
Sold by
Wright Ishmell J and Wright Grace C
Bought by
Deutsche Bank National Trust Co and Morgan Stanley Home Equity Loan Trust 20
Purchase Details
Closed on
Jul 29, 1999
Sold by
Mack David N and Mack Tamra E
Bought by
Wright Ishmell J and Wright Grace C
Home Financials for this Owner
Home Financials are based on the most recent Mortgage that was taken out on this home.
Original Mortgage
$117,025
Interest Rate
7.77%
Mortgage Type
FHA
Purchase Details
Closed on
Jul 30, 1997
Sold by
Eckert Gerald G and Eckert Etta K
Bought by
Mack David N and Mack Tamra E
Create a Home Valuation Report for This Property
The Home Valuation Report is an in-depth analysis detailing your home's value as well as a comparison with similar homes in the area
Home Values in the Area
Average Home Value in this Area
Purchase History
| Date | Buyer | Sale Price | Title Company |
|---|---|---|---|
| Vinebrook Homes Borrower 2 Llc | $1,118,000 | None Listed On Document | |
| Rex Residential Property Owner V Llc | -- | None Available | |
| Rex Residential Property Owner A Llc | -- | None Available | |
| Rex Residential Property Owner Llc | $95,500 | None Available | |
| Miller Thomas W | $150,000 | Attorney | |
| Hild Nikki A | $90,900 | Prism Title & Closing Servic | |
| Deutsche Bank National Trust Co | $96,000 | None Available | |
| Wright Ishmell J | $118,000 | -- | |
| Mack David N | $110,000 | -- |
Source: Public Records
Mortgage History
| Date | Status | Borrower | Loan Amount |
|---|---|---|---|
| Open | Vinebrook Homes Borrower 2 Llc | $403,660,000 | |
| Previous Owner | Rex Residential Property Owner V Llc | $14,494,200 | |
| Previous Owner | Rex Residential Property Owner A Llc | $20,000,000 | |
| Previous Owner | Miller Thomas W | $148,821 | |
| Previous Owner | Wright Ishmell J | $117,025 |
Source: Public Records
Tax History Compared to Growth
Tax History
| Year | Tax Paid | Tax Assessment Tax Assessment Total Assessment is a certain percentage of the fair market value that is determined by local assessors to be the total taxable value of land and additions on the property. | Land | Improvement |
|---|---|---|---|---|
| 2024 | $3,586 | $60,520 | $15,230 | $45,290 |
| 2023 | $3,586 | $60,520 | $15,230 | $45,290 |
| 2022 | $3,230 | $41,740 | $10,500 | $31,240 |
| 2021 | $3,429 | $41,740 | $10,500 | $31,240 |
| 2020 | $3,426 | $41,740 | $10,500 | $31,240 |
| 2019 | $3,047 | $33,160 | $10,500 | $22,660 |
| 2018 | $3,054 | $33,160 | $10,500 | $22,660 |
| 2017 | $3,037 | $33,160 | $10,500 | $22,660 |
| 2016 | $3,379 | $39,550 | $10,500 | $29,050 |
| 2015 | $3,105 | $39,550 | $10,500 | $29,050 |
| 2014 | $3,105 | $39,550 | $10,500 | $29,050 |
| 2012 | -- | $45,780 | $9,650 | $36,130 |
Source: Public Records
Map
Nearby Homes
- 6600 Afton Dr
- 4310 Corydale Ct
- 4250 Willow Creek Dr
- 4311 Reeves Ct
- 3324 Northfield Rd
- 6781 Taywood Rd
- 6885 Garber Rd
- 6624 Stranwood Dr
- 7182 Pugliese Place
- 1264 Westbrook Rd
- 6505 Taywood Rd
- 7116 Dominican Dr
- 4507 Skylark Dr
- 6229 Cheri Lynne Dr
- 7012 Stillmore Dr
- 5420 Savina Ave
- 164 Copperfield Dr
- 173 Copperfield Dr
- 5003 Well Fleet Dr Unit 11RKR
- 133 Copperfield Dr
- 4141 Honeybrook Ave
- 4101 Honeybrook Ave
- 6600 Ranch Hill Dr
- 4161 Honeybrook Ave
- 6601 Ranch Hill Dr
- 4120 Honeybrook Ave
- 6610 Ranch Hill Dr
- 4140 Honeybrook Ave
- 4100 Honeybrook Ave
- 4021 Honeybrook Ave
- 4160 Honeybrook Ave
- 6611 Ranch Hill Dr
- 6620 Ranch Hill Dr
- 6580 Afton Dr
- 6620 Afton Dr
- 4000 Honeybrook Ave
- 3999 Honeybrook Ave
- 6640 Afton Dr
- 6621 Ranch Hill Dr
- 6560 Afton Dr