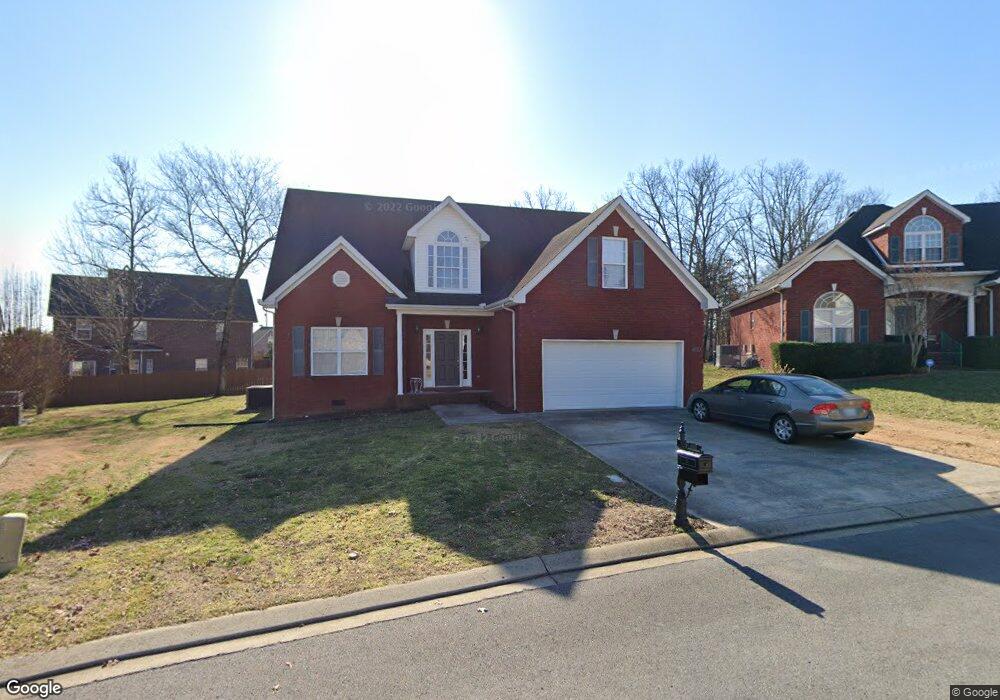
4121 Olivet Dr Murfreesboro, TN 37128
Estimated Value: $434,783 - $486,000
--
Bed
4
Baths
2,298
Sq Ft
$203/Sq Ft
Est. Value
About This Home
This home is located at 4121 Olivet Dr, Murfreesboro, TN 37128 and is currently estimated at $467,196, approximately $203 per square foot. 4121 Olivet Dr is a home located in Rutherford County with nearby schools including Blackman Elementary School, Overall Creek Elementary School, and Blackman Middle School.
Ownership History
Date
Name
Owned For
Owner Type
Purchase Details
Closed on
Nov 20, 2024
Sold by
Ivey Emily Sumali and Luangrath Olee Soumaly
Bought by
Luangrath Olee Soumaly
Current Estimated Value
Purchase Details
Closed on
Sep 15, 2020
Sold by
Ivey Stephen L
Bought by
Ivey Emily Sumali and Ivey Soumaly L
Home Financials for this Owner
Home Financials are based on the most recent Mortgage that was taken out on this home.
Original Mortgage
$119,000
Interest Rate
2.8%
Mortgage Type
New Conventional
Purchase Details
Closed on
Apr 15, 2005
Sold by
Township Homes Llc
Bought by
Ivey Stephen L and Ivey Soumaly L
Home Financials for this Owner
Home Financials are based on the most recent Mortgage that was taken out on this home.
Original Mortgage
$2,020
Interest Rate
5.88%
Mortgage Type
Purchase Money Mortgage
Create a Home Valuation Report for This Property
The Home Valuation Report is an in-depth analysis detailing your home's value as well as a comparison with similar homes in the area
Home Values in the Area
Average Home Value in this Area
Purchase History
| Date | Buyer | Sale Price | Title Company |
|---|---|---|---|
| Luangrath Olee Soumaly | -- | None Listed On Document | |
| Luangrath Olee Soumaly | -- | None Listed On Document | |
| Ivey Emily Sumali | -- | None Available | |
| Ivey Stephen L | $199,000 | -- |
Source: Public Records
Mortgage History
| Date | Status | Borrower | Loan Amount |
|---|---|---|---|
| Previous Owner | Ivey Emily Sumali | $119,000 | |
| Previous Owner | Ivey Stephen L | $2,020 | |
| Previous Owner | Ivey Stephen L | $39,800 |
Source: Public Records
Tax History Compared to Growth
Tax History
| Year | Tax Paid | Tax Assessment Tax Assessment Total Assessment is a certain percentage of the fair market value that is determined by local assessors to be the total taxable value of land and additions on the property. | Land | Improvement |
|---|---|---|---|---|
| 2025 | $2,664 | $94,200 | $13,750 | $80,450 |
| 2024 | $2,664 | $94,200 | $13,750 | $80,450 |
| 2023 | $1,767 | $94,200 | $13,750 | $80,450 |
| 2022 | $1,522 | $94,200 | $13,750 | $80,450 |
| 2021 | $1,454 | $65,525 | $11,250 | $54,275 |
| 2020 | $1,454 | $65,525 | $11,250 | $54,275 |
| 2019 | $1,454 | $65,525 | $11,250 | $54,275 |
| 2018 | $1,998 | $65,525 | $0 | $0 |
| 2017 | $2,026 | $52,125 | $0 | $0 |
| 2016 | $2,026 | $52,125 | $0 | $0 |
| 2015 | $2,026 | $52,125 | $0 | $0 |
| 2014 | $1,296 | $52,125 | $0 | $0 |
| 2013 | -- | $52,250 | $0 | $0 |
Source: Public Records
Map
Nearby Homes
- 467 Bethany Cir
- 718 Sergio Ave
- 4512 Cresto Loop
- 4512 Barone Dr
- 3519 Boxelder Way
- Winston Plan at Melton Estates
- Choral Plan at Melton Estates
- Alpine Plan at Melton Estates
- 814 Maricopa Dr
- 324 Foundry Cir
- 3511 Blaze Dr
- 4509 Larry Melton Dr
- 411 Campfire Dr
- 4670 Forsman Ct
- 3741 Southbend Dr
- 628 Evergreen Dr
- 905 Thunder Gulch Way
- 3402 Almar Knot Dr
- 912 Thunder Gulch Way
- 4134 Sunday Silence Way
- 4125 Olivet Dr
- 421 Bethany Cir
- 425 Bethany Cir
- 417 Bethany Cir
- 429 Bethany Cir
- 4126 Olivet Dr
- 4129 Olivet Dr
- 4113 Olivet Dr
- 4116 Olivet Dr
- 413 Bethany Cir
- 433 Bethany Cir
- 4109 Olivet Dr
- 4133 Olivet Dr
- 422 Carmel Dr
- 4110 Olivet Dr
- 420 Bethany Cir
- 424 Bethany Cir
- 409 Bethany Cir
- 428 Bethany Cir
- 426 Carmel Dr