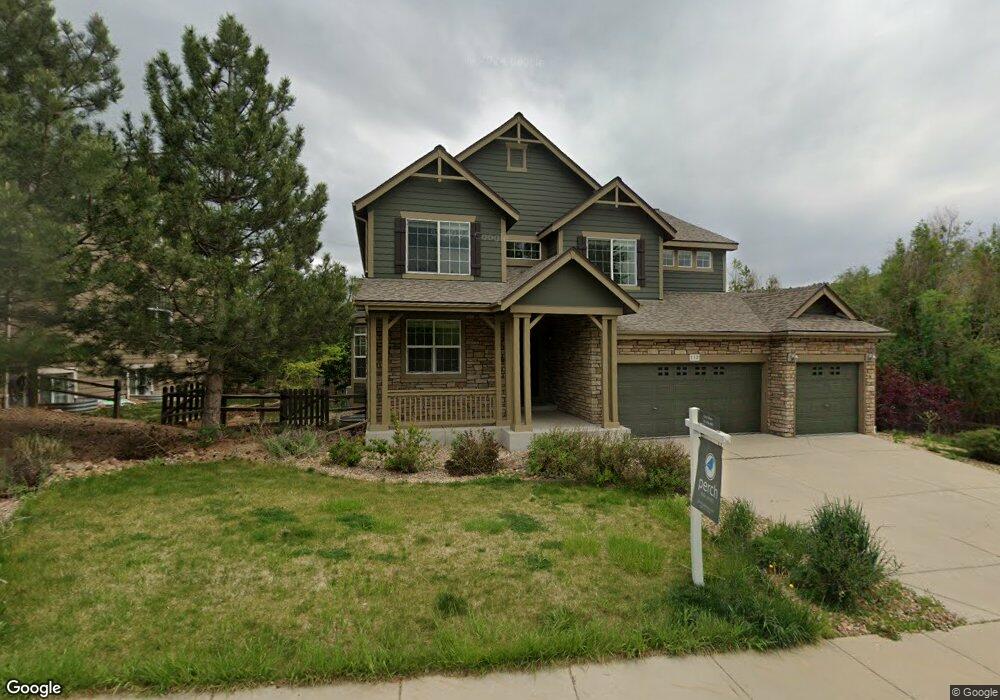
4121 Ute Hwy Longmont, CO 80503
Estimated Value: $649,365 - $810,000
2
Beds
1
Bath
1,000
Sq Ft
$728/Sq Ft
Est. Value
About This Home
This home is located at 4121 Ute Hwy, Longmont, CO 80503 and is currently estimated at $728,091, approximately $728 per square foot. 4121 Ute Hwy is a home located in Boulder County with nearby schools including Lyons Elementary School and Lyons Middle/Senior High School.
Ownership History
Date
Name
Owned For
Owner Type
Purchase Details
Closed on
Mar 10, 2020
Sold by
Whipp Michael A
Bought by
Whipp Property Holdings Llc
Current Estimated Value
Purchase Details
Closed on
Oct 16, 2006
Sold by
Hirschfeld David and Hirschfeld Teri L
Bought by
Whipp Michael A
Home Financials for this Owner
Home Financials are based on the most recent Mortgage that was taken out on this home.
Original Mortgage
$295,000
Interest Rate
7%
Mortgage Type
Purchase Money Mortgage
Purchase Details
Closed on
Mar 28, 1994
Sold by
Hirschfeld Lawrence F and Brodersen Gwendolyn M
Bought by
Hirschfeld David
Home Financials for this Owner
Home Financials are based on the most recent Mortgage that was taken out on this home.
Original Mortgage
$66,000
Interest Rate
7.31%
Purchase Details
Closed on
Oct 12, 1993
Sold by
Hirschfeld Gottlieb
Bought by
Hirschield Lawrence F
Purchase Details
Closed on
Nov 26, 1951
Bought by
Whipp Michael A
Create a Home Valuation Report for This Property
The Home Valuation Report is an in-depth analysis detailing your home's value as well as a comparison with similar homes in the area
Home Values in the Area
Average Home Value in this Area
Purchase History
| Date | Buyer | Sale Price | Title Company |
|---|---|---|---|
| Whipp Property Holdings Llc | -- | None Available | |
| Whipp Michael A | $500,000 | None Available | |
| Hirschfeld David | $72,500 | Stewart Title | |
| Hirschield Lawrence F | $75,000 | -- | |
| Whipp Michael A | -- | -- |
Source: Public Records
Mortgage History
| Date | Status | Borrower | Loan Amount |
|---|---|---|---|
| Closed | Whipp Michael A | $295,000 | |
| Previous Owner | Hirschfeld David | $66,000 |
Source: Public Records
Tax History Compared to Growth
Tax History
| Year | Tax Paid | Tax Assessment Tax Assessment Total Assessment is a certain percentage of the fair market value that is determined by local assessors to be the total taxable value of land and additions on the property. | Land | Improvement |
|---|---|---|---|---|
| 2025 | $4,327 | $36,919 | $14,150 | $22,769 |
| 2024 | $4,327 | $36,919 | $14,150 | $22,769 |
| 2023 | $4,268 | $36,381 | $13,145 | $26,921 |
| 2022 | $3,762 | $30,510 | $12,030 | $18,480 |
| 2021 | $3,716 | $31,389 | $12,377 | $19,012 |
| 2020 | $3,025 | $25,311 | $4,576 | $20,735 |
| 2019 | $2,964 | $25,311 | $4,576 | $20,735 |
| 2018 | $2,543 | $22,147 | $4,536 | $17,611 |
| 2017 | $2,501 | $24,485 | $5,015 | $19,470 |
| 2016 | $2,052 | $15,681 | $4,776 | $10,905 |
| 2015 | $1,729 | $15,108 | $8,239 | $6,869 |
| 2014 | $2,269 | $21,890 | $11,940 | $9,950 |
Source: Public Records
Map
Nearby Homes
- 121 Osprey Ln
- 346 Mcconnell Dr
- 344 Mcconnell Dr
- 618 Overlook Dr
- 515 2nd Ave Unit 7
- 223 Stone Canyon Rd
- 342 4th Ave
- 622 3rd Ave
- 418 High St
- 209 Ewald Ave
- 219 Ewald Ave
- 2450 Eagle Ridge Rd
- 1117 5th Ave
- 1117 N 5th Ave
- 2463 Steamboat Valley Rd
- 0 Apple Valley Rd
- 2615 Eagle Ridge Rd
- 450 Vasquez Ct
- 105 Eagle Canyon Cir
- 2685 Eagle Ridge Rd
- 114 Stone Canyon Dr
- 116 Stone Canyon Dr
- 0 Nolan Rd
- 4115 Ute Hwy
- 4099 Ute Hwy
- 110 Eagle Valley Dr
- 113 Eagle Valley Dr
- 4089 Ute Hwy
- 120 Osprey Ln
- 4167 Ute Hwy
- 4168 Ute Hwy
- 112 Eagle Valley Dr
- 122 Osprey Ln
- 130 Stone Canyon Dr
- 119 Eagle Valley Dr
- 116 Eagle Valley Dr
- 123 Osprey Ln
- 132 Stone Canyon Dr
- 121 Eagle Valley Dr
- 118 Eagle Valley Dr