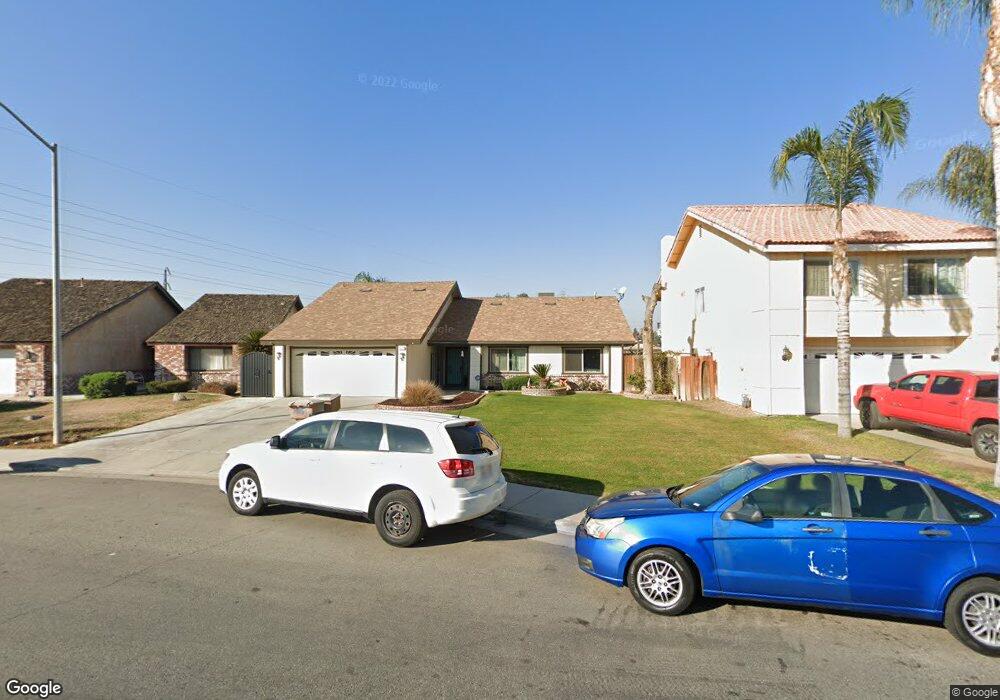
4121 Vaughn Way Bakersfield, CA 93313
Venola NeighborhoodEstimated Value: $342,000 - $366,088
3
Beds
2
Baths
1,805
Sq Ft
$196/Sq Ft
Est. Value
About This Home
This home is located at 4121 Vaughn Way, Bakersfield, CA 93313 and is currently estimated at $353,772, approximately $195 per square foot. 4121 Vaughn Way is a home located in Kern County with nearby schools including Louise Sandrini Elementary School, Fred L. Thompson Junior High School, and West High School.
Ownership History
Date
Name
Owned For
Owner Type
Purchase Details
Closed on
Nov 6, 2003
Sold by
Luttrell Melinda
Bought by
Luttrell Melinda and Mcdonald Jack
Current Estimated Value
Home Financials for this Owner
Home Financials are based on the most recent Mortgage that was taken out on this home.
Original Mortgage
$25,000
Interest Rate
5.69%
Mortgage Type
Credit Line Revolving
Purchase Details
Closed on
Dec 30, 2002
Sold by
Luttrell Darryl
Bought by
Luttrell Melinda
Home Financials for this Owner
Home Financials are based on the most recent Mortgage that was taken out on this home.
Original Mortgage
$98,000
Outstanding Balance
$41,930
Interest Rate
6.06%
Estimated Equity
$311,842
Purchase Details
Closed on
Jul 11, 1996
Sold by
Staub Ronald J and Staub Judith A
Bought by
Luttrell Darryl and Luttrell Melinda
Home Financials for this Owner
Home Financials are based on the most recent Mortgage that was taken out on this home.
Original Mortgage
$99,438
Interest Rate
8.18%
Mortgage Type
FHA
Create a Home Valuation Report for This Property
The Home Valuation Report is an in-depth analysis detailing your home's value as well as a comparison with similar homes in the area
Home Values in the Area
Average Home Value in this Area
Purchase History
| Date | Buyer | Sale Price | Title Company |
|---|---|---|---|
| Luttrell Melinda | -- | -- | |
| Luttrell Melinda | -- | -- | |
| Luttrell Melinda | -- | Stewart | |
| Luttrell Darryl | $100,000 | First American Title Ins Co |
Source: Public Records
Mortgage History
| Date | Status | Borrower | Loan Amount |
|---|---|---|---|
| Closed | Luttrell Melinda | $25,000 | |
| Open | Luttrell Melinda | $98,000 | |
| Closed | Luttrell Darryl | $99,438 |
Source: Public Records
Tax History
| Year | Tax Paid | Tax Assessment Tax Assessment Total Assessment is a certain percentage of the fair market value that is determined by local assessors to be the total taxable value of land and additions on the property. | Land | Improvement |
|---|---|---|---|---|
| 2025 | $2,750 | $172,404 | $47,216 | $125,188 |
| 2024 | $2,706 | $169,025 | $46,291 | $122,734 |
| 2023 | $2,706 | $165,713 | $45,384 | $120,329 |
| 2022 | $2,595 | $162,465 | $44,495 | $117,970 |
| 2021 | $2,485 | $159,281 | $43,623 | $115,658 |
| 2020 | $2,437 | $157,649 | $43,176 | $114,473 |
| 2019 | $2,405 | $157,649 | $43,176 | $114,473 |
| 2018 | $2,302 | $151,529 | $41,500 | $110,029 |
| 2017 | $2,269 | $148,560 | $40,687 | $107,873 |
| 2016 | $2,130 | $145,649 | $39,890 | $105,759 |
| 2015 | $2,110 | $143,462 | $39,291 | $104,171 |
| 2014 | $2,059 | $140,654 | $38,522 | $102,132 |
Source: Public Records
Map
Nearby Homes
- 4424 White Ln
- 4005 Ivywood Ct
- 3717 Cypress Glen Blvd
- 4701 Beechwood St
- 4701 Beechwood St Unit 83
- 4701 Beechwood St Unit 67
- 4701 Beechwood St Unit 74
- 3720 Celine Ct
- 4600 Beechwood St Unit 80
- 4600 Beechwood St Unit 46
- 3840 White Ln
- 3521 Kapral Way
- 4131 Pinewood Lake Dr
- 4136 Pinewood Lake Dr
- 4113 Estate St
- 4413 Estate St
- 3513 Sahara Ln
- 3535 Stine Rd Unit 148
- 3535 Stine Rd Unit 159
- 3535 Stine Rd Unit 48
- 4117 Vaughn Way
- 4125 Vaughn Way
- 4113 Vaughn Way Unit B
- 4417 Newcombe Ave Unit B
- 4109 Vaughn Way
- 4120 Vaughn Way
- 4116 Vaughn Way
- 4112 Vaughn Way
- 4413 Newcombe Ave
- 4105 Vaughn Way
- 4409 Newcombe Ave
- 4108 Vaughn Way Unit B
- 4320 Tretorn Ave
- 4316 Tretorn Ave
- 4405 Newcombe Ave
- 4324 Tretorn Ave
- 4101 Vaughn Way
- 4413 White Ln
- 4312 Tretorn Ave
- 4512 Adidas Ct
Your Personal Tour Guide
Ask me questions while you tour the home.