41213 Erma Ave Fremont, CA 94539
Mission Valley NeighborhoodEstimated Value: $2,136,197 - $2,486,000
4
Beds
2
Baths
2,153
Sq Ft
$1,094/Sq Ft
Est. Value
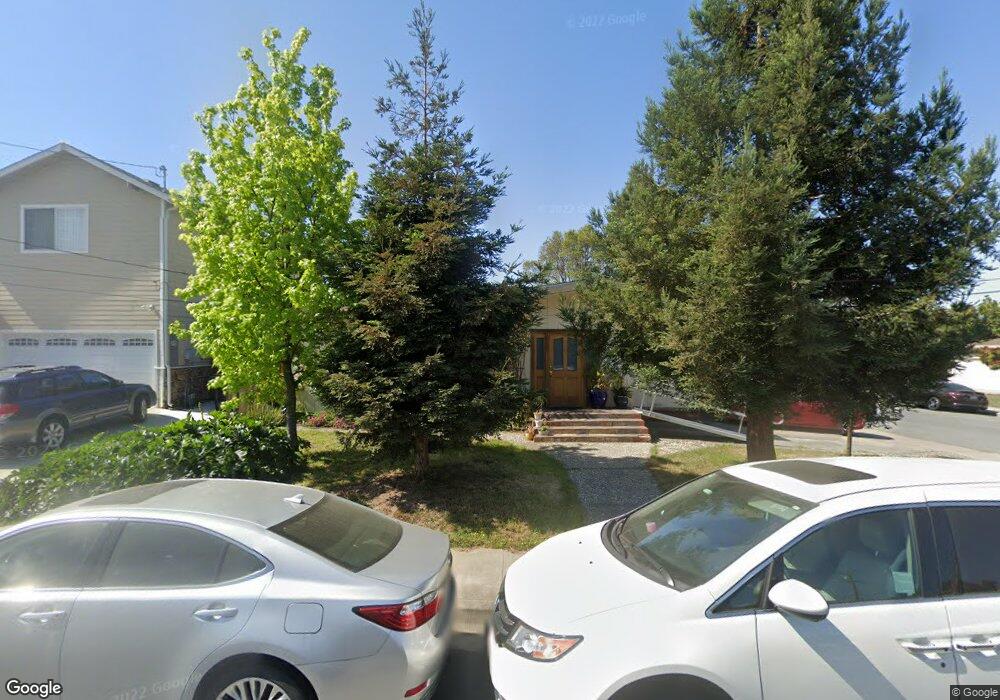
About This Home
This home is located at 41213 Erma Ave, Fremont, CA 94539 and is currently estimated at $2,355,799, approximately $1,094 per square foot. 41213 Erma Ave is a home located in Alameda County with nearby schools including Mission Valley Elementary School, William Hopkins Junior High School, and Mission San Jose High School.
Ownership History
Date
Name
Owned For
Owner Type
Purchase Details
Closed on
Feb 27, 2013
Sold by
Sarabi Asad and Sarabi Sedigheh
Bought by
Tang Huabin and Huang Jenny Jie
Current Estimated Value
Home Financials for this Owner
Home Financials are based on the most recent Mortgage that was taken out on this home.
Original Mortgage
$800,000
Outstanding Balance
$547,090
Interest Rate
2.87%
Mortgage Type
Adjustable Rate Mortgage/ARM
Estimated Equity
$1,808,709
Purchase Details
Closed on
Jan 24, 2013
Sold by
Sarabi Asad and Sarabi Sedigheh
Bought by
Sarabi Asad and Sarabi Sedigheh
Home Financials for this Owner
Home Financials are based on the most recent Mortgage that was taken out on this home.
Original Mortgage
$800,000
Outstanding Balance
$547,090
Interest Rate
2.87%
Mortgage Type
Adjustable Rate Mortgage/ARM
Estimated Equity
$1,808,709
Purchase Details
Closed on
Jul 27, 2011
Sold by
Sarabi Asad and Sarabi Sedigheh
Bought by
Sarabi Asad and Sarabi Sedigheh
Create a Home Valuation Report for This Property
The Home Valuation Report is an in-depth analysis detailing your home's value as well as a comparison with similar homes in the area
Home Values in the Area
Average Home Value in this Area
Purchase History
| Date | Buyer | Sale Price | Title Company |
|---|---|---|---|
| Tang Huabin | $1,000,000 | Chicago Title Company | |
| Sarabi Asad | -- | Chicago Title | |
| Sarabi Asad | -- | None Available |
Source: Public Records
Mortgage History
| Date | Status | Borrower | Loan Amount |
|---|---|---|---|
| Open | Tang Huabin | $800,000 |
Source: Public Records
Tax History Compared to Growth
Tax History
| Year | Tax Paid | Tax Assessment Tax Assessment Total Assessment is a certain percentage of the fair market value that is determined by local assessors to be the total taxable value of land and additions on the property. | Land | Improvement |
|---|---|---|---|---|
| 2025 | $14,422 | $1,224,380 | $615,690 | $615,690 |
| 2024 | $14,422 | $1,200,240 | $603,620 | $603,620 |
| 2023 | $14,046 | $1,183,570 | $591,785 | $591,785 |
| 2022 | $13,878 | $1,153,370 | $580,185 | $580,185 |
| 2021 | $13,533 | $1,130,620 | $568,810 | $568,810 |
| 2020 | $13,619 | $1,125,960 | $562,980 | $562,980 |
| 2019 | $13,461 | $1,103,890 | $551,945 | $551,945 |
| 2018 | $13,199 | $1,082,250 | $541,125 | $541,125 |
| 2017 | $12,869 | $1,061,030 | $530,515 | $530,515 |
| 2016 | $12,657 | $1,040,230 | $520,115 | $520,115 |
| 2015 | $12,496 | $1,024,610 | $512,305 | $512,305 |
| 2014 | $12,287 | $1,004,540 | $502,270 | $502,270 |
Source: Public Records
Map
Nearby Homes
- 41082 Joyce Ave
- 41043 Joyce Ave
- 41620 Beatrice St
- 2851 Finca Terrace
- 41519 Apricot Ln
- 41538 Casabella Common
- 1962 Briscoe Terrace
- 2785 Washington Blvd
- 3331 Union St
- 2225 Valorie St
- 40425 Chapel Way Unit 214
- 40425 Chapel Way Unit 309
- 1224 Bedford St
- 1123 Farragut Dr
- 42329 Troyer Ave
- 1401 Lemos Ln
- 40769 Squill Common
- 41212 Fremont Blvd
- 3800 Adams Ave
- 40708 Fremont Blvd
- 41225 Erma Ave
- 41212 Norman Ct
- 41237 Erma Ave
- 41224 Norman Ct
- 2445 Plumleigh Dr
- 2421 Plumleigh Dr
- 41236 Norman Ct
- 2469 Plumleigh Dr
- 41214 Erma Ave
- 2395 Plumleigh Dr
- 41226 Erma Ave
- 41249 Erma Ave
- 2493 Plumleigh Dr
- 41238 Erma Ave
- 41248 Norman Ct
- 2371 Plumleigh Dr
- 41261 Erma Ave
- 41250 Erma Ave
- 2519 Plumleigh Dr
- 2347 Plumleigh Dr