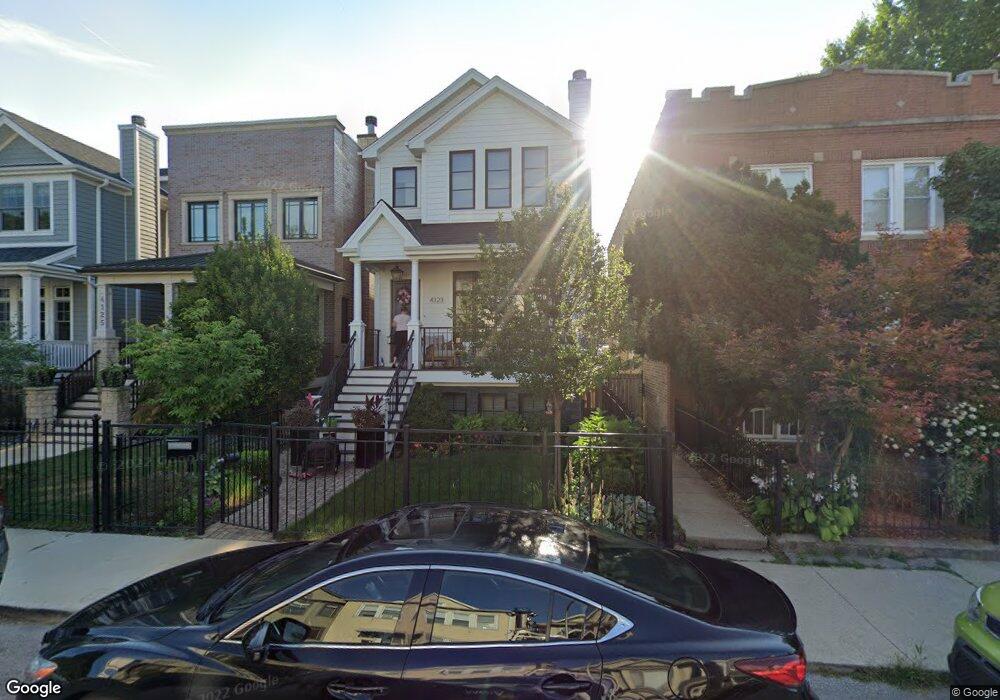
4123 N Oakley Ave Chicago, IL 60618
North Center NeighborhoodEstimated Value: $1,846,329 - $2,235,000
4
Beds
4
Baths
2,799
Sq Ft
$728/Sq Ft
Est. Value
About This Home
This home is located at 4123 N Oakley Ave, Chicago, IL 60618 and is currently estimated at $2,037,332, approximately $727 per square foot. 4123 N Oakley Ave is a home located in Cook County with nearby schools including Coonley Elementary School, Amundsen High School, and Pilgrim Lutheran School.
Ownership History
Date
Name
Owned For
Owner Type
Purchase Details
Closed on
Sep 13, 2019
Sold by
Calzaretta Jessica M and Calzaretta Richard J
Bought by
Lambert Joe and Moster Natalie N
Current Estimated Value
Home Financials for this Owner
Home Financials are based on the most recent Mortgage that was taken out on this home.
Original Mortgage
$1,093,600
Outstanding Balance
$945,758
Interest Rate
3%
Mortgage Type
Adjustable Rate Mortgage/ARM
Estimated Equity
$1,091,574
Purchase Details
Closed on
Mar 19, 2018
Sold by
Westford Development Llc
Bought by
Calzaretta Richard J and Calzaretta Jessica M
Home Financials for this Owner
Home Financials are based on the most recent Mortgage that was taken out on this home.
Original Mortgage
$950,000
Interest Rate
4.37%
Mortgage Type
New Conventional
Purchase Details
Closed on
Aug 11, 2016
Sold by
Alcid Honesto S
Bought by
Westford Development Llc
Home Financials for this Owner
Home Financials are based on the most recent Mortgage that was taken out on this home.
Original Mortgage
$357,500
Interest Rate
4.75%
Mortgage Type
Commercial
Create a Home Valuation Report for This Property
The Home Valuation Report is an in-depth analysis detailing your home's value as well as a comparison with similar homes in the area
Home Values in the Area
Average Home Value in this Area
Purchase History
| Date | Buyer | Sale Price | Title Company |
|---|---|---|---|
| Lambert Joe | $1,367,000 | Proper Title Llc | |
| Calzaretta Richard J | $1,420,000 | Greater Illinois Title | |
| Westford Development Llc | $550,000 | Greater Metropolitan Title L |
Source: Public Records
Mortgage History
| Date | Status | Borrower | Loan Amount |
|---|---|---|---|
| Open | Lambert Joe | $1,093,600 | |
| Previous Owner | Calzaretta Richard J | $950,000 | |
| Previous Owner | Westford Development Llc | $357,500 |
Source: Public Records
Tax History Compared to Growth
Tax History
| Year | Tax Paid | Tax Assessment Tax Assessment Total Assessment is a certain percentage of the fair market value that is determined by local assessors to be the total taxable value of land and additions on the property. | Land | Improvement |
|---|---|---|---|---|
| 2024 | $30,594 | $163,000 | $34,565 | $128,435 |
| 2023 | $29,824 | $145,000 | $27,900 | $117,100 |
| 2022 | $29,824 | $145,000 | $27,900 | $117,100 |
| 2021 | $29,158 | $145,000 | $27,900 | $117,100 |
| 2020 | $28,571 | $128,253 | $14,880 | $113,373 |
| 2019 | $28,316 | $140,938 | $14,880 | $126,058 |
| 2018 | $2,939 | $14,880 | $14,880 | $0 |
| 2017 | $2,803 | $13,020 | $13,020 | $0 |
| 2016 | $9,760 | $48,729 | $13,020 | $35,709 |
| 2015 | $5,923 | $48,729 | $13,020 | $35,709 |
| 2014 | $5,872 | $40,305 | $9,920 | $30,385 |
| 2013 | $5,892 | $40,305 | $9,920 | $30,385 |
Source: Public Records
Map
Nearby Homes
- 2335 W Belle Plaine Ave Unit 207
- 2335 W Belle Plaine Ave Unit 508
- 2335 W Belle Plaine Ave Unit 211
- 2335 W Belle Plaine Ave Unit 205
- 2415 W Belle Plaine Ave
- 2244 W Irving Park Rd
- 2438 W Berteau Ave
- 4333 N Oakley Ave
- 2107 W Berteau Ave
- 2468 W Berteau Ave
- 2140 W Irving Park Rd
- 3920 N Bell Ave
- 2321 W Montrose Ave
- 2316 W Byron St Unit 2
- 2039 W Berteau Ave
- 2461 W Pensacola Ave
- 2433 W Dakin St
- 3846 N Bell Ave
- 3902 N Hamilton Ave
- 2030 W Irving Park Rd Unit 1
- 4123 N Oakley Ave
- 4125 N Oakley Ave
- 4121 N Oakley Ave
- 4129 N Oakley Ave
- 4129 N Oakley Ave
- 4131 N Oakley Ave
- 4115 N Oakley Ave
- 4133 N Oakley Ave Unit 3
- 4133 N Oakley Ave
- 4111 N Oakley Ave
- 4137 N Oakley Ave
- 4120 N Bell Ave
- 4126 N Bell Ave
- 4109 N Oakley Ave
- 4118 N Bell Ave
- 4128 N Bell Ave
- 4139 N Oakley Ave
- 4122 N Oakley Ave
- 4116 N Bell Ave
- 4116 N Bell Ave