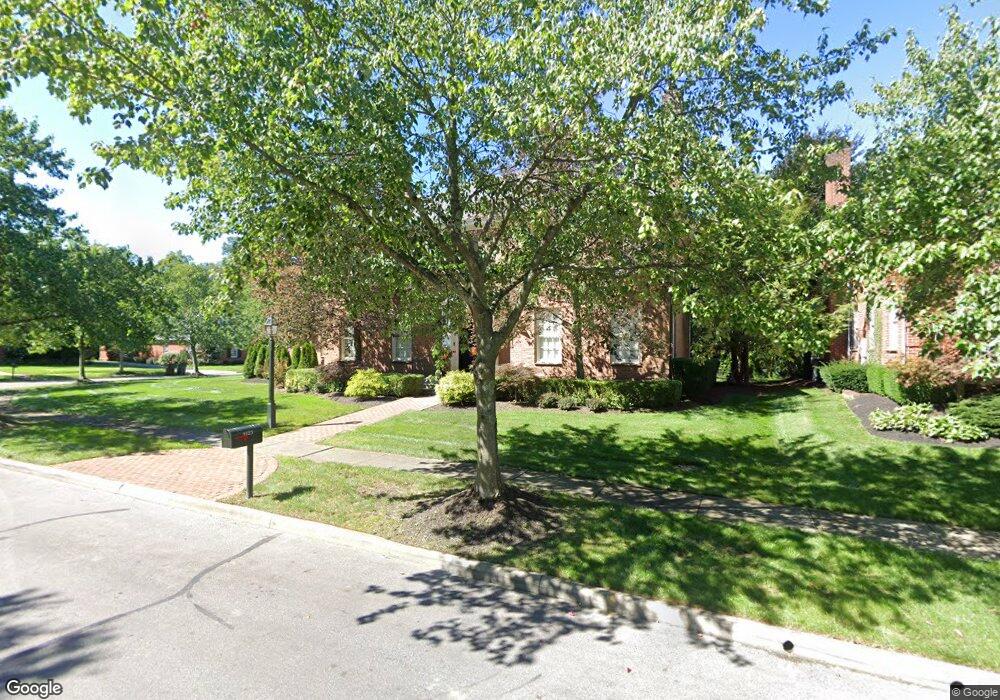
4123 Sudbrook Square E New Albany, OH 43054
Estimated Value: $1,323,728 - $1,615,000
4
Beds
6
Baths
5,200
Sq Ft
$276/Sq Ft
Est. Value
About This Home
This home is located at 4123 Sudbrook Square E, New Albany, OH 43054 and is currently estimated at $1,436,182, approximately $276 per square foot. 4123 Sudbrook Square E is a home located in Franklin County with nearby schools including New Albany Primary School, New Albany Intermediate School, and New Albany Middle School.
Ownership History
Date
Name
Owned For
Owner Type
Purchase Details
Closed on
Jun 30, 2009
Sold by
Sachatello Susan and Procopio Stephen L
Bought by
Klynn Bethany L and Payne Benjamin H
Current Estimated Value
Home Financials for this Owner
Home Financials are based on the most recent Mortgage that was taken out on this home.
Original Mortgage
$417,000
Interest Rate
5.29%
Mortgage Type
Purchase Money Mortgage
Purchase Details
Closed on
Aug 15, 2003
Sold by
Clark Sheila
Bought by
Procopio Stephen L and Sachatello Susan
Home Financials for this Owner
Home Financials are based on the most recent Mortgage that was taken out on this home.
Original Mortgage
$400,000
Interest Rate
5.02%
Mortgage Type
Balloon
Purchase Details
Closed on
Aug 30, 1994
Sold by
New Albany Co
Bought by
Moorehead Mark L and Moorehead Janice K
Home Financials for this Owner
Home Financials are based on the most recent Mortgage that was taken out on this home.
Original Mortgage
$96,750
Interest Rate
8.72%
Mortgage Type
New Conventional
Create a Home Valuation Report for This Property
The Home Valuation Report is an in-depth analysis detailing your home's value as well as a comparison with similar homes in the area
Home Values in the Area
Average Home Value in this Area
Purchase History
| Date | Buyer | Sale Price | Title Company |
|---|---|---|---|
| Klynn Bethany L | $675,000 | Fidelity | |
| Procopio Stephen L | -- | Stewart Title Agency Of Colu | |
| Clark Sheila | $840,000 | Stewart Title Agency Of Colu | |
| Moorehead Mark L | $107,500 | -- |
Source: Public Records
Mortgage History
| Date | Status | Borrower | Loan Amount |
|---|---|---|---|
| Previous Owner | Klynn Bethany L | $417,000 | |
| Previous Owner | Clark Sheila | $400,000 | |
| Previous Owner | Moorehead Mark L | $96,750 |
Source: Public Records
Tax History Compared to Growth
Tax History
| Year | Tax Paid | Tax Assessment Tax Assessment Total Assessment is a certain percentage of the fair market value that is determined by local assessors to be the total taxable value of land and additions on the property. | Land | Improvement |
|---|---|---|---|---|
| 2024 | $22,152 | $356,060 | $77,000 | $279,060 |
| 2023 | $20,935 | $356,055 | $77,000 | $279,055 |
| 2022 | $19,727 | $254,910 | $55,130 | $199,780 |
| 2021 | $18,985 | $254,910 | $55,130 | $199,780 |
| 2020 | $18,964 | $254,910 | $55,130 | $199,780 |
| 2019 | $19,735 | $242,590 | $52,500 | $190,090 |
| 2018 | $20,280 | $242,590 | $52,500 | $190,090 |
| 2017 | $19,812 | $242,590 | $52,500 | $190,090 |
| 2016 | $21,020 | $238,140 | $59,430 | $178,710 |
| 2015 | $21,060 | $238,140 | $59,430 | $178,710 |
| 2014 | $19,744 | $238,140 | $59,430 | $178,710 |
| 2013 | $10,161 | $226,800 | $56,595 | $170,205 |
Source: Public Records
Map
Nearby Homes
- 5950 Johnstown Rd
- 5945 Johnstown Rd
- 7 Richmond Square
- 14 Richmond Square
- 7747 Sutton Place
- 3637 Head of Pond Rd
- 115 Keswick Dr
- 105 Keswick Dr
- 6590 Wheatly Rd
- 6540 Wheatly Rd Unit LOT 701
- 3377 Abberley Dr Unit LOT 902
- 6544 Wheatly Rd Unit LOT 702
- 6929 Clivdon Mews
- 4135 High Grove Crest
- 7030 Hanby's Loop
- 6526 Wheatly Rd Unit LOT 802
- 6531 Wheatly Rd Unit LOT 102
- 6522 Wheatly Rd Unit LOT 801
- 6532 Wheatly Rd Unit LOT 804
- 6528 Wheatly Rd Unit LOT 803
- 4137 Sudbrook Square E
- 0 Sudbrook Square Unit 5
- 29 Sudbrook Square
- 4128 Sudbrook Square W
- 4144 Sudbrook Square W
- 7727 Sudbrook Square
- 7715 Sudbrook Square
- 4122 Sudbrook Square E
- 4151 Sudbrook Square E
- 4136 Sudbrook Square E
- 4110 Sudbrook Square E
- 7703 Sudbrook Square
- 4156 Sudbrook Square W
- 7739 Sudbrook Square
- 4150 Sudbrook Square E
- 4165 Sudbrook Square E
- 4168 Sudbrook Square W
- 4131 Sudbrook Square W
- 4121 Belmont Place
- 4145 Sudbrook Square W