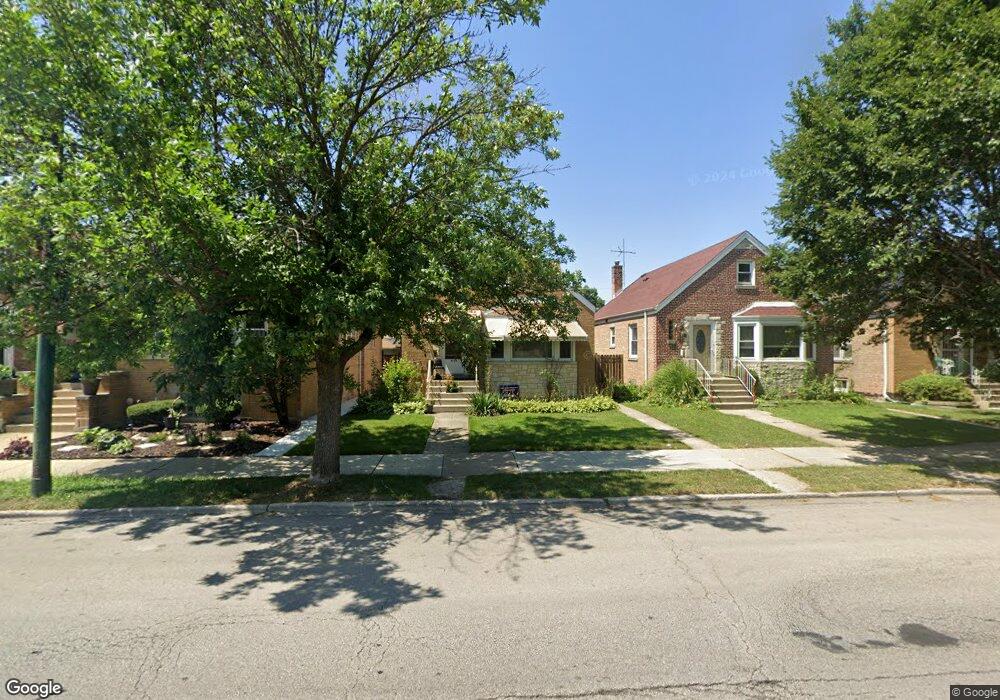
4124 N Central Ave Chicago, IL 60634
Portage Park NeighborhoodEstimated Value: $372,000 - $472,000
3
Beds
3
Baths
1,411
Sq Ft
$306/Sq Ft
Est. Value
About This Home
This home is located at 4124 N Central Ave, Chicago, IL 60634 and is currently estimated at $431,241, approximately $305 per square foot. 4124 N Central Ave is a home located in Cook County with nearby schools including Portage Park Elementary School, Schurz High School, and Pope Francis Global Academy.
Ownership History
Date
Name
Owned For
Owner Type
Purchase Details
Closed on
Jan 20, 2017
Sold by
Barrientos James D and Barrientos Marina C
Bought by
Barrientos James D and The James & Marina Barrientos Family Tr
Current Estimated Value
Purchase Details
Closed on
Jun 15, 1999
Sold by
Victorson Jeffrey A and Victorson Dorothy A
Bought by
Barrientos James D and Barrientos Marina C
Home Financials for this Owner
Home Financials are based on the most recent Mortgage that was taken out on this home.
Original Mortgage
$140,000
Interest Rate
8%
Purchase Details
Closed on
Mar 31, 1995
Sold by
Gille Michael W
Bought by
Victorson Jeffrey A and Chelinski Dorothy A
Home Financials for this Owner
Home Financials are based on the most recent Mortgage that was taken out on this home.
Original Mortgage
$84,000
Interest Rate
8.91%
Purchase Details
Closed on
May 10, 1994
Sold by
Gille Michael W
Bought by
Gille Michael W
Create a Home Valuation Report for This Property
The Home Valuation Report is an in-depth analysis detailing your home's value as well as a comparison with similar homes in the area
Home Values in the Area
Average Home Value in this Area
Purchase History
| Date | Buyer | Sale Price | Title Company |
|---|---|---|---|
| Barrientos James D | -- | Near North National Title | |
| Barrientos James D | $175,000 | Proffesional National Title | |
| Victorson Jeffrey A | $120,500 | First American Title | |
| Gille Michael W | -- | -- |
Source: Public Records
Mortgage History
| Date | Status | Borrower | Loan Amount |
|---|---|---|---|
| Previous Owner | Barrientos James D | $140,000 | |
| Previous Owner | Victorson Jeffrey A | $84,000 |
Source: Public Records
Tax History Compared to Growth
Tax History
| Year | Tax Paid | Tax Assessment Tax Assessment Total Assessment is a certain percentage of the fair market value that is determined by local assessors to be the total taxable value of land and additions on the property. | Land | Improvement |
|---|---|---|---|---|
| 2024 | $3,481 | $39,000 | $14,525 | $24,475 |
| 2023 | $3,501 | $34,000 | $11,620 | $22,380 |
| 2022 | $3,501 | $34,000 | $11,620 | $22,380 |
| 2021 | $5,632 | $34,000 | $11,620 | $22,380 |
| 2020 | $3,439 | $30,236 | $6,017 | $24,219 |
| 2019 | $5,510 | $33,596 | $6,017 | $27,579 |
| 2018 | $3,377 | $33,596 | $6,017 | $27,579 |
| 2017 | $3,672 | $23,131 | $5,395 | $17,736 |
| 2016 | $3,985 | $24,175 | $5,395 | $18,780 |
| 2015 | $3,951 | $26,059 | $5,395 | $20,664 |
| 2014 | $3,857 | $25,189 | $4,980 | $20,209 |
| 2013 | $4,298 | $28,140 | $4,980 | $23,160 |
Source: Public Records
Map
Nearby Homes
- 4025 N Menard Ave
- 5706 W Dakin St
- 5410 W Hutchinson St
- 5436 W Dakin St
- 4230 N Monitor Ave
- 5601 W Byron St Unit A
- 5704 W Montrose Ave Unit 2B
- 4051 N Marmora Ave
- 4256 N Monitor Ave
- 5501 W Byron St
- 5401 W Montrose Ave
- 4215 N Lockwood Ave Unit 6
- 5448 W Agatite Ave
- 5255 W Belle Plaine Ave
- 5354 W Montrose Ave
- 5817 W Byron St
- 4130 N Mason Ave
- 5253 W Cullom Ave
- 4414 N Monitor Ave
- 3746 N Central Ave Unit 1H
- 4120 N Central Ave
- 4118 N Central Ave
- 4130 N Central Ave
- 4134 N Central Ave
- 4138 N Central Ave
- 4125 N Parkside Ave
- 4129 N Parkside Ave
- 4121 N Parkside Ave
- 4131 N Parkside Ave
- 4108 N Central Ave
- 4117 N Parkside Ave
- 4142 N Central Ave
- 4135 N Parkside Ave
- 4113 N Parkside Ave
- 4139 N Parkside Ave
- 4104 N Central Ave
- 4146 N Central Ave
- 4141 N Parkside Ave
- 4107 N Parkside Ave
- 4150 N Central Ave