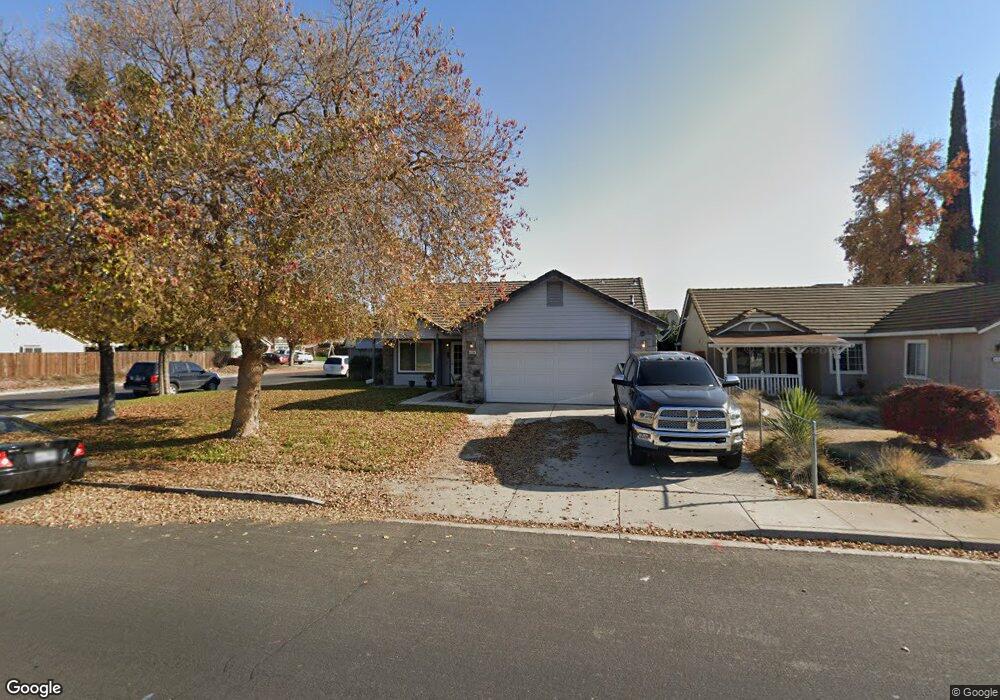
4124 Wincanton Rd Salida, CA 95368
Estimated Value: $407,000 - $435,000
3
Beds
2
Baths
1,156
Sq Ft
$363/Sq Ft
Est. Value
About This Home
This home is located at 4124 Wincanton Rd, Salida, CA 95368 and is currently estimated at $419,877, approximately $363 per square foot. 4124 Wincanton Rd is a home located in Stanislaus County with nearby schools including Dena Boer Elementary School, Salida Middle School - Vella Campus, and Joseph A. Gregori High School.
Ownership History
Date
Name
Owned For
Owner Type
Purchase Details
Closed on
Jul 24, 1997
Sold by
Hud
Bought by
Taylor Denise C
Current Estimated Value
Home Financials for this Owner
Home Financials are based on the most recent Mortgage that was taken out on this home.
Original Mortgage
$92,556
Outstanding Balance
$13,346
Interest Rate
7.57%
Mortgage Type
FHA
Estimated Equity
$406,531
Purchase Details
Closed on
Feb 25, 1997
Sold by
Espinoza Adrian P and Espinoza Ana C
Bought by
Countrywide Home Loans Inc and Countrywide Funding Corp
Purchase Details
Closed on
Jan 31, 1997
Sold by
Countrywide Home Loans Inc
Bought by
Hud
Purchase Details
Closed on
Mar 28, 1995
Sold by
Somerset Estates Inc
Bought by
Espinoza Adrian P and Espinoza Ana C
Home Financials for this Owner
Home Financials are based on the most recent Mortgage that was taken out on this home.
Original Mortgage
$103,834
Interest Rate
8.9%
Mortgage Type
FHA
Create a Home Valuation Report for This Property
The Home Valuation Report is an in-depth analysis detailing your home's value as well as a comparison with similar homes in the area
Home Values in the Area
Average Home Value in this Area
Purchase History
| Date | Buyer | Sale Price | Title Company |
|---|---|---|---|
| Taylor Denise C | $93,000 | North American Title Co | |
| Countrywide Home Loans Inc | $111,756 | First American Title Co | |
| Hud | -- | First American Title Ins Co | |
| Espinoza Adrian P | $105,000 | First American Title Co |
Source: Public Records
Mortgage History
| Date | Status | Borrower | Loan Amount |
|---|---|---|---|
| Open | Taylor Denise C | $92,556 | |
| Previous Owner | Espinoza Adrian P | $103,834 |
Source: Public Records
Tax History
| Year | Tax Paid | Tax Assessment Tax Assessment Total Assessment is a certain percentage of the fair market value that is determined by local assessors to be the total taxable value of land and additions on the property. | Land | Improvement |
|---|---|---|---|---|
| 2025 | $3,381 | $148,475 | $47,891 | $100,584 |
| 2024 | $3,325 | $145,564 | $46,952 | $98,612 |
| 2023 | $3,272 | $142,711 | $46,032 | $96,679 |
| 2022 | $3,176 | $139,914 | $45,130 | $94,784 |
| 2021 | $3,132 | $137,172 | $44,246 | $92,926 |
| 2020 | $3,020 | $135,767 | $43,793 | $91,974 |
| 2019 | $2,982 | $133,106 | $42,935 | $90,171 |
| 2018 | $3,014 | $130,497 | $42,094 | $88,403 |
| 2017 | $2,963 | $127,939 | $41,269 | $86,670 |
| 2016 | $2,914 | $125,431 | $40,460 | $84,971 |
| 2015 | $2,884 | $123,548 | $39,853 | $83,695 |
| 2014 | $2,859 | $121,129 | $39,073 | $82,056 |
Source: Public Records
Map
Nearby Homes
- 4013 Wincanton Rd
- 4221 Legacy Ct
- 4736 Carlson Way
- 4216 Meadow Brook Ln
- 4701 Magnolia St
- 0 Finney Rd
- 4209 Godfrey Dr
- 5019 Parks Ave
- 5216 Pasatiempo Dr
- 3424 Vintage Dr Unit 244
- 4524 Wessex Ln
- 5220 San Paulo Dr
- 4217 Marabella Ct
- 3400 Sullivan Ct Unit 220
- 3400 Sullivan Ct Unit 106
- 3400 Sullivan Ct Unit 272
- 4529 Fallbrook Place
- 5417 Newquay Ln
- 3304 Swallow Dr
- 3264 Showcase Way
- 4120 Wincanton Rd
- 4308 Gastonbury Ct
- 4116 Wincanton Rd
- 4204 Wincanton Rd
- 4301 Cannington Ln
- 4304 Gastonbury Ct
- 4127 Wincanton Rd
- 4112 Wincanton Rd
- 4201 Wincanton Rd
- 4208 Wincanton Rd
- 4205 Wincanton Rd
- 4309 Gastonbury Ct
- 4307 Cannington Ln
- 4300 Gastonbury Ct
- 4108 Wincanton Rd
- 4305 Gastonbury Ct
- 4209 Wincanton Rd
- 4212 Wincanton Rd
- 4301 Gastonbury Ct
- 4213 Dunster Dr
Your Personal Tour Guide
Ask me questions while you tour the home.