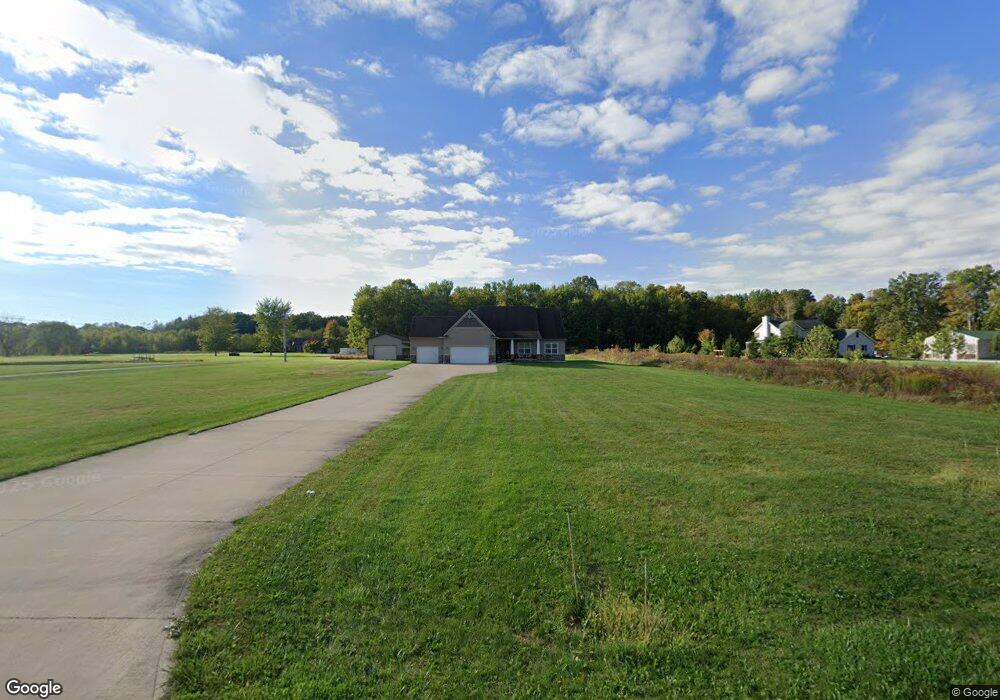
41245 Webster Rd Lagrange, OH 44050
Estimated Value: $299,000 - $496,458
3
Beds
2
Baths
1,857
Sq Ft
$217/Sq Ft
Est. Value
About This Home
This home is located at 41245 Webster Rd, Lagrange, OH 44050 and is currently estimated at $402,615, approximately $216 per square foot. 41245 Webster Rd is a home with nearby schools including Keystone Elementary School, Keystone Middle School, and Keystone High School.
Ownership History
Date
Name
Owned For
Owner Type
Purchase Details
Closed on
Oct 31, 2014
Sold by
Hammond Robert C and Hammond Tammy S
Bought by
Anderson Jennifer
Current Estimated Value
Home Financials for this Owner
Home Financials are based on the most recent Mortgage that was taken out on this home.
Original Mortgage
$276,451
Outstanding Balance
$215,958
Interest Rate
4.23%
Mortgage Type
Future Advance Clause Open End Mortgage
Estimated Equity
$186,657
Purchase Details
Closed on
Feb 25, 2014
Sold by
Myers Harold K and Myers Sandra D
Bought by
Hammond Robert C and Hammond Tammy S
Purchase Details
Closed on
Aug 22, 2005
Sold by
Pass Craig A and Pass Brenda S
Bought by
Myers Harold K and Myers Sandra D
Home Financials for this Owner
Home Financials are based on the most recent Mortgage that was taken out on this home.
Original Mortgage
$63,750
Interest Rate
5%
Mortgage Type
Fannie Mae Freddie Mac
Create a Home Valuation Report for This Property
The Home Valuation Report is an in-depth analysis detailing your home's value as well as a comparison with similar homes in the area
Purchase History
| Date | Buyer | Sale Price | Title Company |
|---|---|---|---|
| Anderson Jennifer | $67,000 | None Available | |
| Hammond Robert C | $6,250 | First American Title Ins Co | |
| Myers Harold K | $85,000 | Paragon Title Agency Inc |
Source: Public Records
Mortgage History
| Date | Status | Borrower | Loan Amount |
|---|---|---|---|
| Open | Anderson Jennifer | $276,451 | |
| Previous Owner | Myers Harold K | $63,750 |
Source: Public Records
Tax History
| Year | Tax Paid | Tax Assessment Tax Assessment Total Assessment is a certain percentage of the fair market value that is determined by local assessors to be the total taxable value of land and additions on the property. | Land | Improvement |
|---|---|---|---|---|
| 2024 | $5,598 | $134,194 | $24,133 | $110,061 |
| 2023 | $6,247 | $123,417 | $28,007 | $95,410 |
| 2022 | $6,203 | $123,417 | $28,007 | $95,410 |
| 2021 | $6,204 | $123,417 | $28,007 | $95,410 |
| 2020 | $5,760 | $102,420 | $23,240 | $79,180 |
| 2019 | $5,684 | $102,420 | $23,240 | $79,180 |
| 2018 | $5,709 | $102,420 | $23,240 | $79,180 |
| 2017 | $6,267 | $105,200 | $24,630 | $80,570 |
| 2016 | $5,787 | $98,510 | $24,630 | $73,880 |
| 2015 | $1,332 | $22,380 | $22,380 | $0 |
| 2014 | $1,099 | $20,920 | $20,920 | $0 |
| 2013 | $1,052 | $20,920 | $20,920 | $0 |
Source: Public Records
Map
Nearby Homes
- 510 Arabian Ct
- 476 Stallion Ct
- 468 Stallion Ct
- 42113 Meadow Ln
- 20630 State Route 301
- 704 Black Bear Run
- 43311 Peck Wadsworth Rd
- 40260 Whitney Rd
- 0 West Rd Unit 5125531
- 0 Ohio 301
- 110 Railroad St
- 305 W Main St
- 0 Dill Ct Unit 5072837
- 317 Church St
- 516 Appomattox Ct
- 548 William St
- 567 Vicksburg Ct
- 23095 Foster Rd
- 340 Granger Dr
- 808 Buckingham Dr
- 41241 Webster Rd
- 41255 Webster Rd
- VL Webster Rd
- 41222 Webster Rd
- 41235 Webster Rd
- 41267 Webster Rd
- 41225 Webster Rd
- 41248 Webster Rd
- 41321 Webster Rd
- 41288 Webster Rd
- 41155 Webster Rd
- 41337 Webster Rd
- 41336 Webster Rd
- 41405 Webster Rd
- 41380 Webster Rd
- 19616 State Route 301
- 41428 Webster Rd
- 41425 Webster Rd
- SL E Sr 301
- SL F Sr 301
Your Personal Tour Guide
Ask me questions while you tour the home.