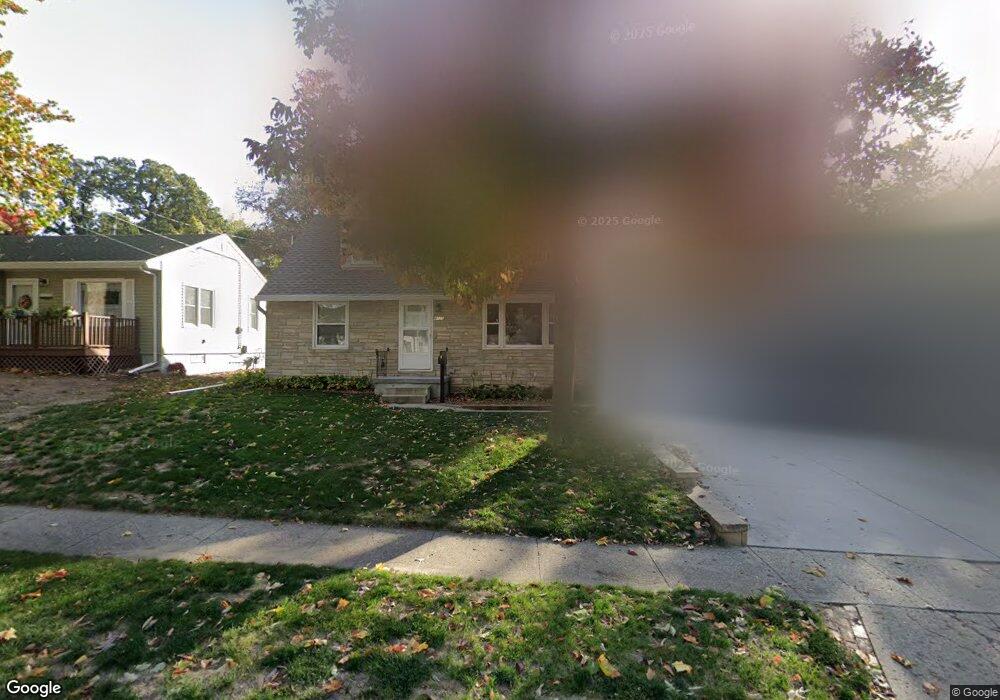
4125 10th St Des Moines, IA 50313
Oak Park NeighborhoodEstimated Value: $188,000 - $199,000
3
Beds
1
Bath
1,304
Sq Ft
$148/Sq Ft
Est. Value
About This Home
This home is located at 4125 10th St, Des Moines, IA 50313 and is currently estimated at $192,499, approximately $147 per square foot. 4125 10th St is a home located in Polk County with nearby schools including Oak Park Elementary School, Harding Middle School, and North High School.
Ownership History
Date
Name
Owned For
Owner Type
Purchase Details
Closed on
May 9, 2011
Sold by
Carroll Christine R
Bought by
Carroll William M
Current Estimated Value
Purchase Details
Closed on
Jan 17, 2005
Sold by
Carroll William M and Carroll Christine R
Bought by
Carroll William M and Carroll Christine R
Create a Home Valuation Report for This Property
The Home Valuation Report is an in-depth analysis detailing your home's value as well as a comparison with similar homes in the area
Home Values in the Area
Average Home Value in this Area
Purchase History
| Date | Buyer | Sale Price | Title Company |
|---|---|---|---|
| Carroll William M | -- | None Available | |
| Carroll William M | -- | -- |
Source: Public Records
Tax History
| Year | Tax Paid | Tax Assessment Tax Assessment Total Assessment is a certain percentage of the fair market value that is determined by local assessors to be the total taxable value of land and additions on the property. | Land | Improvement |
|---|---|---|---|---|
| 2025 | $2,842 | $195,100 | $36,700 | $158,400 |
| 2024 | $2,842 | $170,600 | $31,600 | $139,000 |
| 2023 | $3,314 | $170,600 | $31,600 | $139,000 |
| 2022 | $3,286 | $152,900 | $29,600 | $123,300 |
| 2021 | $3,230 | $152,900 | $29,600 | $123,300 |
| 2020 | $3,348 | $141,300 | $27,200 | $114,100 |
| 2019 | $2,994 | $141,300 | $27,200 | $114,100 |
| 2018 | $2,956 | $123,200 | $23,300 | $99,900 |
| 2017 | $2,638 | $123,200 | $23,300 | $99,900 |
| 2016 | $2,562 | $109,300 | $20,300 | $89,000 |
| 2015 | $2,562 | $109,300 | $20,300 | $89,000 |
| 2014 | $2,532 | $111,200 | $20,300 | $90,900 |
Source: Public Records
Map
Nearby Homes
Your Personal Tour Guide
Ask me questions while you tour the home.