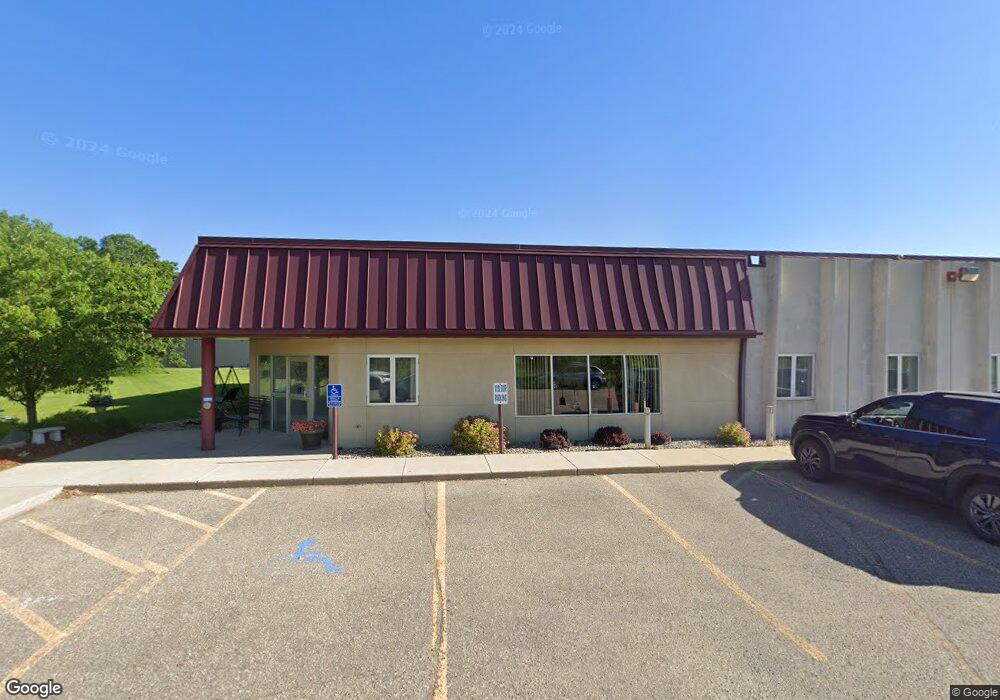
4125 Minnesota St Alexandria, MN 56308
Estimated Value: $2,019,008
--
Bed
--
Bath
8,963
Sq Ft
$225/Sq Ft
Est. Value
About This Home
This home is located at 4125 Minnesota St, Alexandria, MN 56308 and is currently estimated at $2,019,008, approximately $225 per square foot. 4125 Minnesota St is a home located in Douglas County with nearby schools including Lincoln Elementary School, Discovery Middle School, and Alexandria Area High School.
Ownership History
Date
Name
Owned For
Owner Type
Purchase Details
Closed on
Mar 30, 2017
Sold by
Black Well Associates Llc
Bought by
Douglas County Developmental Achievement
Current Estimated Value
Home Financials for this Owner
Home Financials are based on the most recent Mortgage that was taken out on this home.
Original Mortgage
$320,000
Outstanding Balance
$265,483
Interest Rate
4.1%
Mortgage Type
Future Advance Clause Open End Mortgage
Estimated Equity
$1,753,525
Purchase Details
Closed on
Dec 29, 2006
Sold by
Golden Oak Investments Llc
Bought by
Blackwell Assn Llc
Home Financials for this Owner
Home Financials are based on the most recent Mortgage that was taken out on this home.
Original Mortgage
$771,047
Interest Rate
6.24%
Mortgage Type
Commercial
Create a Home Valuation Report for This Property
The Home Valuation Report is an in-depth analysis detailing your home's value as well as a comparison with similar homes in the area
Home Values in the Area
Average Home Value in this Area
Purchase History
| Date | Buyer | Sale Price | Title Company |
|---|---|---|---|
| Douglas County Developmental Achievement | -- | None Available | |
| Blackwell Assn Llc | $950,000 | None Available |
Source: Public Records
Mortgage History
| Date | Status | Borrower | Loan Amount |
|---|---|---|---|
| Open | Douglas County Developmental Achievement | $320,000 | |
| Previous Owner | Blackwell Assn Llc | $771,047 |
Source: Public Records
Tax History Compared to Growth
Tax History
| Year | Tax Paid | Tax Assessment Tax Assessment Total Assessment is a certain percentage of the fair market value that is determined by local assessors to be the total taxable value of land and additions on the property. | Land | Improvement |
|---|---|---|---|---|
| 2025 | -- | $721,600 | $119,200 | $602,400 |
| 2024 | -- | $686,800 | $113,600 | $573,200 |
| 2023 | $0 | $649,900 | $104,400 | $545,500 |
| 2022 | $0 | $616,500 | $96,700 | $519,800 |
| 2021 | $0 | $587,400 | $96,700 | $490,700 |
| 2020 | $0 | $587,400 | $96,700 | $490,700 |
| 2019 | $0 | $578,600 | $96,700 | $481,900 |
| 2018 | $16,362 | $558,800 | $92,100 | $466,700 |
| 2017 | $16,838 | $558,300 | $92,100 | $466,200 |
| 2016 | $21,138 | $541,551 | $89,337 | $452,214 |
| 2015 | $24,338 | $0 | $0 | $0 |
| 2014 | -- | $644,700 | $156,300 | $488,400 |
Source: Public Records
Map
Nearby Homes
- 2025 42nd Ave W
- xxx 34th Ave W
- xx 34th Ave W
- TBD 34th Ave W
- TBD Nevada St SW
- XXXX Dakota St
- 4XXX Dakota St
- TBD 48th Ave
- TBD 44th Ave W
- TBD 50th Ave W
- 00 30th Ave
- 2402 Reeds Villa Rd SW
- 1626 Melvina Ln SW
- 2212 Jefferson St
- 10xx 22nd Ave E
- 9xx 22nd Ave E
- 1205 Melvina Rd SW
- 1405 Bryant St
- 4760 Country Shores SW
- TBD 34th Ave E
- 4129 Minnesota St
- 2045 42nd Ave W
- 1524 42nd Ave
- 0 42nd Ave
- 2010 42nd Ave W
- 2040 42nd Ave W
- 2030 42nd Ave W
- 4021 Nevada St SW
- 1910 42nd Ave W Unit 400
- 1910 42nd Ave W Unit 300
- 1910 42nd Ave W Unit 200
- 1930 42nd Ave W
- 4011 Nevada St SW
- 1920 42nd Ave W
- 1910 39th Ave W
- 1 39 Ave
- 0 W 39th Ave
- 3711 Nevada St SW
- 3818 Nevada St SW
- 00 Highwy 27--W