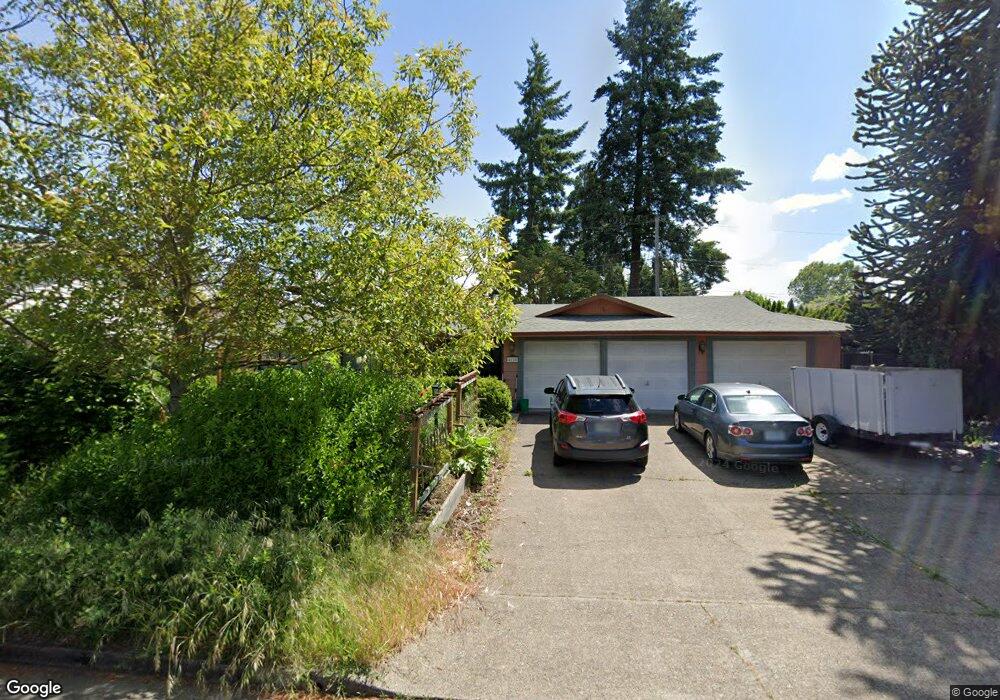
4125 Shannon St Eugene, OR 97404
Santa Clara NeighborhoodEstimated Value: $382,000 - $397,000
3
Beds
1
Bath
1,311
Sq Ft
$298/Sq Ft
Est. Value
About This Home
This home is located at 4125 Shannon St, Eugene, OR 97404 and is currently estimated at $390,180, approximately $297 per square foot. 4125 Shannon St is a home located in Lane County with nearby schools including Awbrey Park Elementary School, Madison Middle School, and North Eugene High School.
Ownership History
Date
Name
Owned For
Owner Type
Purchase Details
Closed on
Aug 30, 2017
Sold by
Friedt Gregory Joseph
Bought by
Miller Yvonne and Friedt Gregory Joseph
Current Estimated Value
Home Financials for this Owner
Home Financials are based on the most recent Mortgage that was taken out on this home.
Original Mortgage
$13,666
Interest Rate
3.96%
Mortgage Type
Unknown
Purchase Details
Closed on
Aug 29, 2017
Sold by
Miller Yvonne and Friedt Greg
Bought by
Friedt Gregory Joseph and Friedt Family Trust 1996 Trust
Home Financials for this Owner
Home Financials are based on the most recent Mortgage that was taken out on this home.
Original Mortgage
$13,666
Interest Rate
3.96%
Mortgage Type
Unknown
Purchase Details
Closed on
Aug 25, 2017
Sold by
Miller Yvonne and Friedt Kelsey
Bought by
Friedt Gregory Joseph
Home Financials for this Owner
Home Financials are based on the most recent Mortgage that was taken out on this home.
Original Mortgage
$13,666
Interest Rate
3.96%
Mortgage Type
Unknown
Create a Home Valuation Report for This Property
The Home Valuation Report is an in-depth analysis detailing your home's value as well as a comparison with similar homes in the area
Home Values in the Area
Average Home Value in this Area
Purchase History
| Date | Buyer | Sale Price | Title Company |
|---|---|---|---|
| Miller Yvonne | -- | Cascade Title Company | |
| Friedt Gregory Joseph | -- | Cascade Title Company | |
| Friedt Gregory Joseph | $104,666 | Cascade Title Company |
Source: Public Records
Mortgage History
| Date | Status | Borrower | Loan Amount |
|---|---|---|---|
| Closed | Miller Yvonne | $13,666 | |
| Closed | Friedt Gregory Joseph | $27,333 |
Source: Public Records
Tax History
| Year | Tax Paid | Tax Assessment Tax Assessment Total Assessment is a certain percentage of the fair market value that is determined by local assessors to be the total taxable value of land and additions on the property. | Land | Improvement |
|---|---|---|---|---|
| 2025 | $2,595 | $202,758 | -- | -- |
| 2024 | $2,582 | $196,853 | -- | -- |
| 2023 | $2,582 | $191,120 | $0 | $0 |
| 2022 | $2,426 | $185,554 | $0 | $0 |
| 2021 | $2,226 | $180,150 | $0 | $0 |
| 2020 | $2,268 | $174,903 | $0 | $0 |
| 2019 | $2,184 | $169,809 | $0 | $0 |
| 2018 | $2,011 | $160,062 | $0 | $0 |
| 2017 | $1,869 | $160,062 | $0 | $0 |
| 2016 | $1,757 | $155,400 | $0 | $0 |
| 2015 | $1,689 | $150,874 | $0 | $0 |
| 2014 | $1,582 | $146,480 | $0 | $0 |
Source: Public Records
Map
Nearby Homes
- 355 River Loop 2
- 514 Warrington Ave
- 329 Dean Ave
- 47 van Fossen Ct
- 4483 Thunderbird St
- 4471 Spring Meadow Ave
- 4366 Berry Ln
- 528 Nottingham Ave
- 110 Calumet Ave
- 556 Cinderella Loop
- 4795 Thunderbird St
- 4490 Doyle St
- 212 Chimney Rock Ln
- 3708 Kirsten St
- 591 Argon Ave
- 709 Tyson Ln
- 850 E Beacon Dr
- 3910 Andover St
- 374 Blackfoot Ave
- 90 Daniel Dr
- 4143 Shannon St
- 4115 Shannon St
- 241 Shamrock Ct
- 253 Shamrock Ct
- 4159 Shannon St
- 229 Shamrock Ct
- 4120 Shannon St
- 4138 Shannon St
- 4091 Shannon St
- 213 Oroyan Ave
- 265 Shamrock Ct
- 4156 Shannon St
- 4173 Shannon St
- 217 Shamrock Ct
- 4075 Shannon St
- 4133 Scottdale St
- 4151 Scottdale St
- 4115 Scottdale St
- 4174 Shannon St
- 234 Shamrock Ct
Your Personal Tour Guide
Ask me questions while you tour the home.