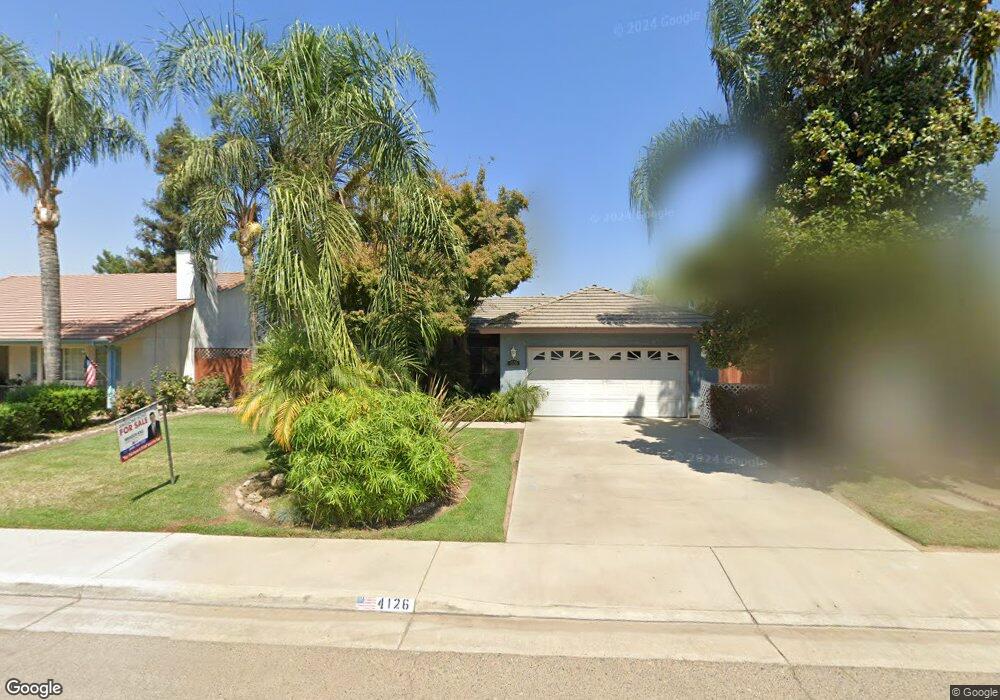
4126 E Laurel Ave Visalia, CA 93292
Southeast Visalia NeighborhoodEstimated Value: $371,000 - $388,000
3
Beds
2
Baths
1,508
Sq Ft
$252/Sq Ft
Est. Value
About This Home
This home is located at 4126 E Laurel Ave, Visalia, CA 93292 and is currently estimated at $379,324, approximately $251 per square foot. 4126 E Laurel Ave is a home located in Tulare County with nearby schools including Mineral King Elementary School, Valley Oak Middle School, and Golden West High School.
Ownership History
Date
Name
Owned For
Owner Type
Purchase Details
Closed on
Dec 31, 2019
Sold by
Rose Herschall C and Rose Sheri Lolene
Bought by
Rose Herschall C and Rose Sheri Lolene
Current Estimated Value
Purchase Details
Closed on
Sep 24, 2004
Sold by
Rose Herschall C
Bought by
Rose Herschall C and Rose Sheri Lolene
Home Financials for this Owner
Home Financials are based on the most recent Mortgage that was taken out on this home.
Original Mortgage
$167,000
Outstanding Balance
$82,651
Interest Rate
5.76%
Mortgage Type
Stand Alone Refi Refinance Of Original Loan
Estimated Equity
$296,673
Purchase Details
Closed on
Nov 20, 1995
Sold by
Packwood Real Estate Partners
Bought by
Rose Herschall C and Rose Janet
Home Financials for this Owner
Home Financials are based on the most recent Mortgage that was taken out on this home.
Original Mortgage
$147,758
Interest Rate
7.18%
Mortgage Type
Purchase Money Mortgage
Create a Home Valuation Report for This Property
The Home Valuation Report is an in-depth analysis detailing your home's value as well as a comparison with similar homes in the area
Home Values in the Area
Average Home Value in this Area
Purchase History
| Date | Buyer | Sale Price | Title Company |
|---|---|---|---|
| Rose Herschall C | -- | None Available | |
| Rose Herschall C | -- | Chicago Title Co | |
| Rose Herschall C | -- | Chicago Title Co | |
| Rose Herschall C | $148,000 | First American Title Ins Co |
Source: Public Records
Mortgage History
| Date | Status | Borrower | Loan Amount |
|---|---|---|---|
| Open | Rose Herschall C | $167,000 | |
| Previous Owner | Rose Herschall C | $147,758 |
Source: Public Records
Tax History Compared to Growth
Tax History
| Year | Tax Paid | Tax Assessment Tax Assessment Total Assessment is a certain percentage of the fair market value that is determined by local assessors to be the total taxable value of land and additions on the property. | Land | Improvement |
|---|---|---|---|---|
| 2025 | $2,635 | $245,873 | $66,453 | $179,420 |
| 2024 | $2,635 | $241,052 | $65,150 | $175,902 |
| 2023 | $2,564 | $236,326 | $63,873 | $172,453 |
| 2022 | $2,443 | $231,693 | $62,621 | $169,072 |
| 2021 | $2,445 | $227,150 | $61,393 | $165,757 |
| 2020 | $2,426 | $224,820 | $60,763 | $164,057 |
| 2019 | $2,357 | $220,412 | $59,572 | $160,840 |
| 2018 | $2,247 | $211,000 | $53,000 | $158,000 |
| 2017 | $2,129 | $199,000 | $50,000 | $149,000 |
| 2016 | $2,130 | $183,000 | $46,000 | $137,000 |
| 2015 | $1,905 | $171,000 | $43,000 | $128,000 |
| 2014 | $1,905 | $159,000 | $40,000 | $119,000 |
Source: Public Records
Map
Nearby Homes
- 424 S McAuliff St
- 1708 S Arroyo St
- 3931 E Hillcrest Ave
- 4222 E Cambridge Ave
- 3926 E Myrtle Ave
- 4122 E Kaweah Ave
- 4132 E Kaweah Ave
- 3735 E Cambridge Ct
- 804 S Simon St
- 3728 E Kaweah Ave
- 3235 E Howard Ave
- 1701 S Crumal St
- 3541 E Laura Ct
- 2242 S Manzanita Ct
- 3320 E Laura Ave
- 2945 E College Ave
- 2928 E Tulare Ave
- 15061 Avenue 288
- 3201 E Harter Ave
- 3136 E Harter Ave
- 4116 E Laurel Ave
- 4136 E Laurel Ave
- 4127 E Sue Ave
- 4139 E Sue Ave
- 4117 E Sue Ave
- 4140 E Laurel Ave
- 4106 E Laurel Ave
- 4125 E Laurel Ave
- 4143 E Sue Ave
- 4135 E Laurel Ave
- 4135 E Laurel Ct
- 4107 E Sue Ave
- 4146 E Laurel Ave
- 4141 E Laurel Ave
- 4105 E Laurel Ave
- 4149 E Sue Ave
- 4147 E Laurel Ave
- 4204 E Laurel Ave
- 4128 E Sue Ave
- 4040 E Laurel Ct