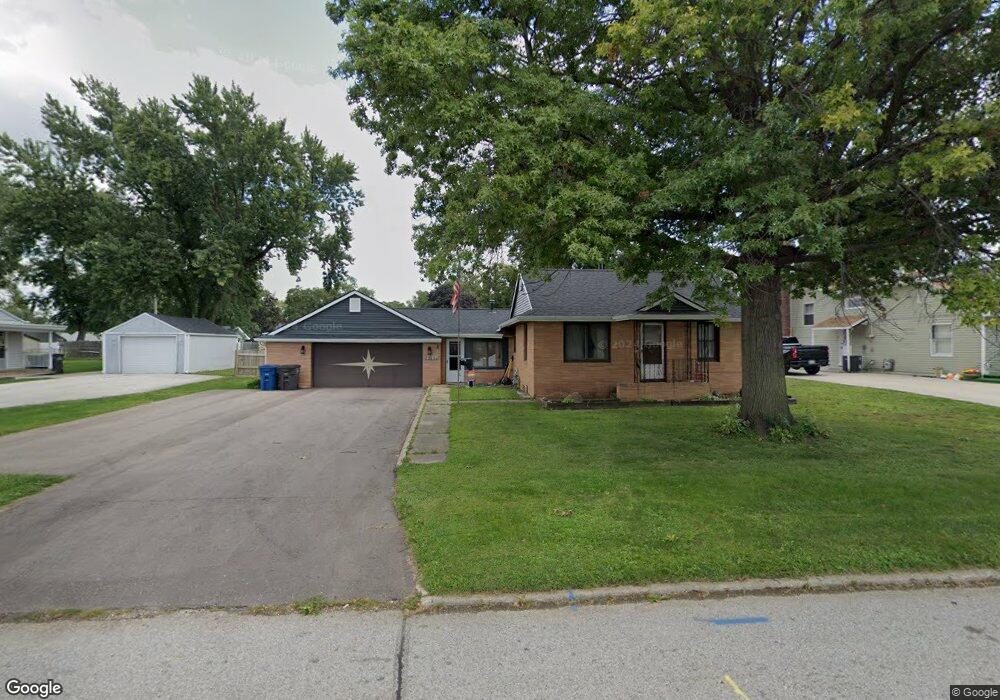
4127 56th St Des Moines, IA 50310
Merle Hay NeighborhoodEstimated Value: $152,000 - $201,000
3
Beds
1
Bath
884
Sq Ft
$208/Sq Ft
Est. Value
About This Home
This home is located at 4127 56th St, Des Moines, IA 50310 and is currently estimated at $183,909, approximately $208 per square foot. 4127 56th St is a home located in Polk County with nearby schools including Moore Elementary School, Meredith Middle School, and Hoover High School.
Ownership History
Date
Name
Owned For
Owner Type
Purchase Details
Closed on
Aug 18, 2017
Sold by
Williams Robert
Bought by
Anderson Jodies Jeanette
Current Estimated Value
Purchase Details
Closed on
Sep 14, 2006
Sold by
Lemley M B
Bought by
Williams Robert and Anderson Williams Jodie
Home Financials for this Owner
Home Financials are based on the most recent Mortgage that was taken out on this home.
Original Mortgage
$90,000
Interest Rate
6.59%
Mortgage Type
Purchase Money Mortgage
Create a Home Valuation Report for This Property
The Home Valuation Report is an in-depth analysis detailing your home's value as well as a comparison with similar homes in the area
Home Values in the Area
Average Home Value in this Area
Purchase History
| Date | Buyer | Sale Price | Title Company |
|---|---|---|---|
| Anderson Jodies Jeanette | -- | None Available | |
| Williams Robert | $89,500 | None Available |
Source: Public Records
Mortgage History
| Date | Status | Borrower | Loan Amount |
|---|---|---|---|
| Previous Owner | Williams Robert | $90,000 |
Source: Public Records
Tax History
| Year | Tax Paid | Tax Assessment Tax Assessment Total Assessment is a certain percentage of the fair market value that is determined by local assessors to be the total taxable value of land and additions on the property. | Land | Improvement |
|---|---|---|---|---|
| 2025 | $3,042 | $186,600 | $52,600 | $134,000 |
| 2024 | $3,042 | $165,100 | $45,800 | $119,300 |
| 2023 | $3,050 | $165,100 | $45,800 | $119,300 |
| 2022 | $3,026 | $138,300 | $40,200 | $98,100 |
| 2021 | $3,034 | $138,300 | $40,200 | $98,100 |
| 2020 | $3,148 | $130,200 | $37,500 | $92,700 |
| 2019 | $2,892 | $130,200 | $37,500 | $92,700 |
| 2018 | $2,856 | $116,100 | $32,900 | $83,200 |
| 2017 | $2,626 | $116,100 | $32,900 | $83,200 |
| 2016 | $2,552 | $105,600 | $29,400 | $76,200 |
| 2015 | $2,552 | $105,600 | $29,400 | $76,200 |
| 2014 | $2,218 | $95,500 | $26,200 | $69,300 |
Source: Public Records
Map
Nearby Homes
Your Personal Tour Guide
Ask me questions while you tour the home.