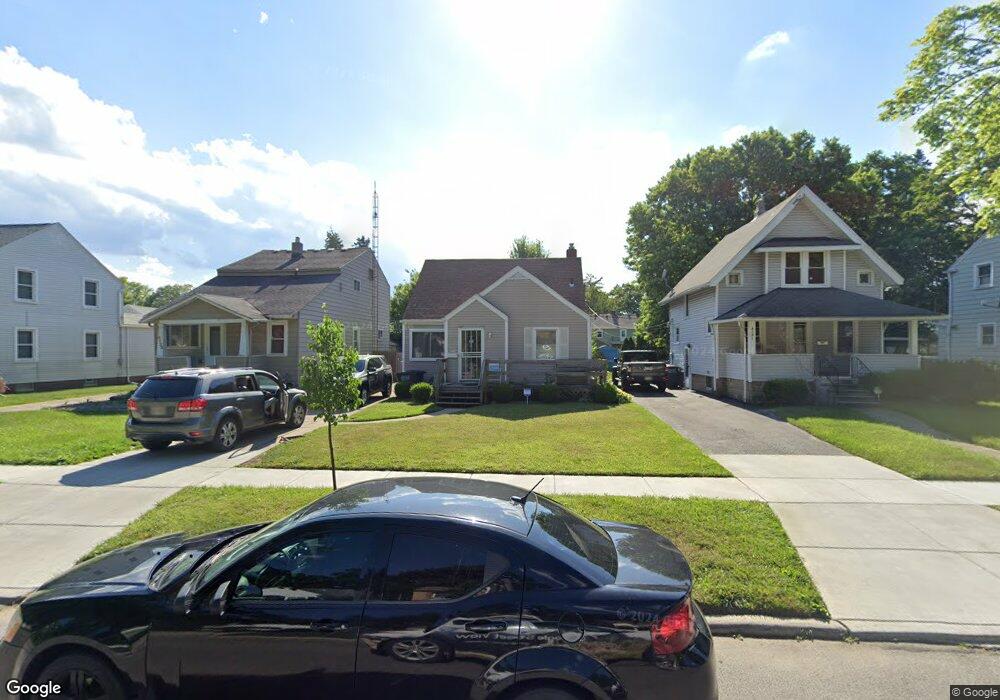
4127 Bowen Rd Toledo, OH 43613
DeVeaux NeighborhoodEstimated Value: $110,000 - $171,000
3
Beds
2
Baths
1,441
Sq Ft
$106/Sq Ft
Est. Value
About This Home
This home is located at 4127 Bowen Rd, Toledo, OH 43613 and is currently estimated at $153,039, approximately $106 per square foot. 4127 Bowen Rd is a home located in Lucas County with nearby schools including Elmhurst Elementary School, Start High School, and Horizon Science Academy - Toledo High School.
Ownership History
Date
Name
Owned For
Owner Type
Purchase Details
Closed on
Jun 4, 2025
Sold by
Mcclain Diana M
Bought by
Mack Tressie E
Current Estimated Value
Purchase Details
Closed on
Oct 30, 2020
Sold by
Mack Tressie Elaine
Bought by
Mcclain Diana
Purchase Details
Closed on
Jan 21, 2009
Sold by
Secretary Of Housing & Urban Development
Bought by
Mack Tressie Elaine
Purchase Details
Closed on
Feb 11, 2008
Sold by
Leitner Peter S
Bought by
Gmac Mortgage Llc
Purchase Details
Closed on
Dec 13, 2007
Sold by
Gmac Mortgage Llc
Bought by
Hud
Purchase Details
Closed on
Jan 18, 2000
Sold by
Langenderfer Matthew J
Bought by
Leitner Peter S
Home Financials for this Owner
Home Financials are based on the most recent Mortgage that was taken out on this home.
Original Mortgage
$88,454
Interest Rate
7.81%
Mortgage Type
FHA
Purchase Details
Closed on
Jul 1, 1993
Sold by
Dumke Michael A #
Purchase Details
Closed on
Jul 28, 1992
Sold by
Dumke Michael A and Dumke Denise
Purchase Details
Closed on
Jul 28, 1989
Sold by
Landrith C P and G P
Create a Home Valuation Report for This Property
The Home Valuation Report is an in-depth analysis detailing your home's value as well as a comparison with similar homes in the area
Home Values in the Area
Average Home Value in this Area
Purchase History
| Date | Buyer | Sale Price | Title Company |
|---|---|---|---|
| Mack Tressie E | -- | None Listed On Document | |
| Mcclain Diana | -- | None Available | |
| Mack Tressie Elaine | $52,000 | Lakeside Title & Escrow Agen | |
| Gmac Mortgage Llc | $128,099 | Attorney | |
| Hud | -- | None Available | |
| Leitner Peter S | $88,500 | Midland Title | |
| -- | $63,500 | -- | |
| -- | -- | -- | |
| -- | $58,300 | -- |
Source: Public Records
Mortgage History
| Date | Status | Borrower | Loan Amount |
|---|---|---|---|
| Previous Owner | Leitner Peter S | $88,454 |
Source: Public Records
Tax History Compared to Growth
Tax History
| Year | Tax Paid | Tax Assessment Tax Assessment Total Assessment is a certain percentage of the fair market value that is determined by local assessors to be the total taxable value of land and additions on the property. | Land | Improvement |
|---|---|---|---|---|
| 2024 | $1,127 | $36,085 | $6,265 | $29,820 |
| 2023 | $2,096 | $32,095 | $5,530 | $26,565 |
| 2022 | $2,093 | $32,095 | $5,530 | $26,565 |
| 2021 | $2,148 | $32,095 | $5,530 | $26,565 |
| 2020 | $2,023 | $26,705 | $4,620 | $22,085 |
| 2019 | $1,978 | $26,705 | $4,620 | $22,085 |
| 2018 | $1,897 | $26,705 | $4,620 | $22,085 |
| 2017 | $5,718 | $24,080 | $4,690 | $19,390 |
| 2016 | $3,696 | $68,800 | $13,400 | $55,400 |
| 2015 | $1,818 | $68,800 | $13,400 | $55,400 |
| 2014 | $1,515 | $24,080 | $4,690 | $19,390 |
| 2013 | $1,515 | $24,080 | $4,690 | $19,390 |
Source: Public Records
Map
Nearby Homes
- 4210 Bowen Rd
- 4250 Garrison Rd
- 2645 Grantwood Dr
- 3951 Buell Ave
- 2645 Westbrook Dr
- 4158 Kingsmoor Dr
- 3905 Rushland Ave
- 3840 Grantley Rd
- 3840 Garrison Rd
- 3832 Grantley Rd
- 2560 Charlestown Ave
- 2640 Westbrook Dr
- 3832 Woodmont Rd
- 3827 Grantley Rd
- 4440 Woodmont Rd
- 3805 Garrison Rd
- 2513 Grantwood Dr
- 2855 Castleton Ave
- 4128 Douglas Rd
- 4220 Douglas Rd
- 4123 Bowen Rd
- 4135 Bowen Rd
- 4119 Bowen Rd
- 4139 Bowen Rd
- 4115 Bowen Rd
- 4128 Grantley Rd
- 4132 Grantley Rd
- 4124 Grantley Rd
- 4143 Bowen Rd
- 4136 Grantley Rd
- 4111 Bowen Rd
- 4120 Grantley Rd
- 4140 Grantley Rd
- 4116 Grantley Rd
- 4128 Bowen Rd
- 4132 Bowen Rd
- 4124 Bowen Rd
- 4147 Bowen Rd
- 4107 Bowen Rd
- 4136 Bowen Rd