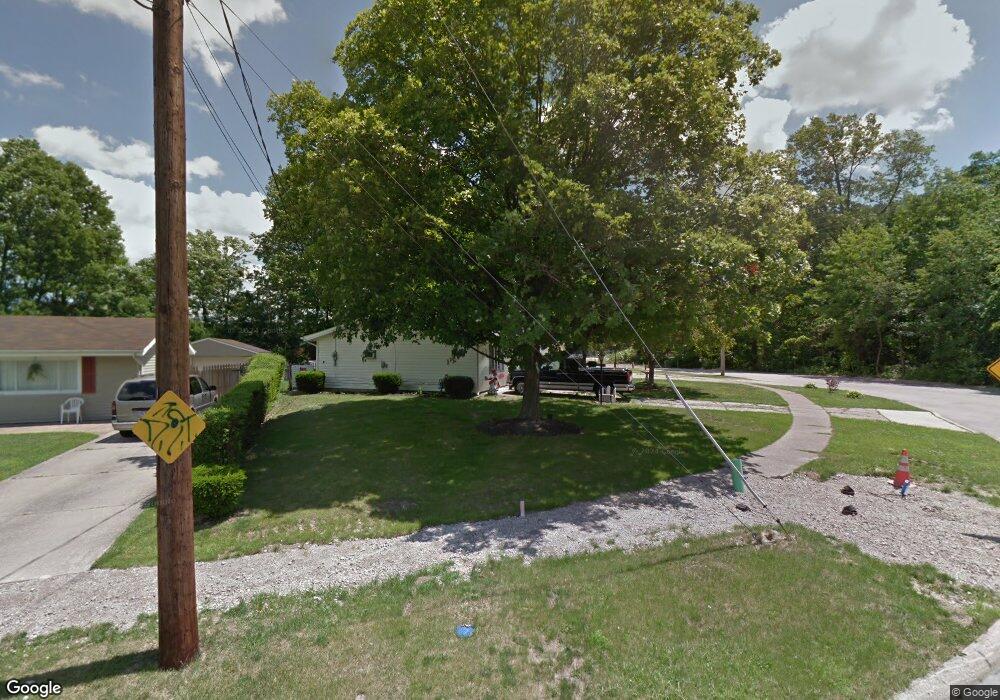
4127 Denison Ave Lorain, OH 44055
Estimated Value: $157,260 - $172,000
4
Beds
2
Baths
1,923
Sq Ft
$86/Sq Ft
Est. Value
About This Home
This home is located at 4127 Denison Ave, Lorain, OH 44055 and is currently estimated at $165,815, approximately $86 per square foot. 4127 Denison Ave is a home located in Lorain County with nearby schools including Helen Steiner Rice Elementary School, Southview Middle School, and Lorain High School.
Ownership History
Date
Name
Owned For
Owner Type
Purchase Details
Closed on
Oct 20, 2023
Sold by
Phillipp Robert J
Bought by
Yee Fay
Current Estimated Value
Home Financials for this Owner
Home Financials are based on the most recent Mortgage that was taken out on this home.
Original Mortgage
$82,509
Outstanding Balance
$78,348
Interest Rate
7.19%
Mortgage Type
FHA
Estimated Equity
$87,467
Purchase Details
Closed on
Nov 9, 2021
Sold by
Palmieri Doinic E
Bought by
Phillipp Robert J
Purchase Details
Closed on
Jun 19, 2006
Sold by
Pilarsh Judith L
Bought by
Not Provided Dominic C
Purchase Details
Closed on
Dec 20, 1996
Sold by
Safi Renee
Bought by
Pilarsh Judith L
Home Financials for this Owner
Home Financials are based on the most recent Mortgage that was taken out on this home.
Original Mortgage
$38,000
Interest Rate
7.74%
Mortgage Type
New Conventional
Purchase Details
Closed on
Jun 5, 1996
Sold by
Major Norita
Bought by
Pilarsh Judith L
Purchase Details
Closed on
Mar 26, 1996
Sold by
Dudukovich Cynthia
Bought by
Pilarsh Judith L
Create a Home Valuation Report for This Property
The Home Valuation Report is an in-depth analysis detailing your home's value as well as a comparison with similar homes in the area
Home Values in the Area
Average Home Value in this Area
Purchase History
| Date | Buyer | Sale Price | Title Company |
|---|---|---|---|
| Yee Fay | $95,400 | None Listed On Document | |
| Phillipp Robert J | $90,000 | None Available | |
| Not Provided Dominic C | $98,800 | None Available | |
| Pilarsh Judith L | $10,000 | -- | |
| Pilarsh Judith L | $60,000 | -- | |
| Pilarsh Judith L | $20,000 | -- |
Source: Public Records
Mortgage History
| Date | Status | Borrower | Loan Amount |
|---|---|---|---|
| Open | Yee Fay | $82,509 | |
| Previous Owner | Pilarsh Judith L | $38,000 |
Source: Public Records
Tax History
| Year | Tax Paid | Tax Assessment Tax Assessment Total Assessment is a certain percentage of the fair market value that is determined by local assessors to be the total taxable value of land and additions on the property. | Land | Improvement |
|---|---|---|---|---|
| 2024 | $1,843 | $44,692 | $4,200 | $40,492 |
| 2023 | $1,938 | $37,629 | $5,478 | $32,151 |
| 2022 | $1,921 | $37,629 | $5,478 | $32,151 |
| 2021 | $1,921 | $37,629 | $5,478 | $32,151 |
| 2020 | $1,781 | $30,300 | $4,410 | $25,890 |
| 2019 | $1,771 | $30,300 | $4,410 | $25,890 |
| 2018 | $1,748 | $30,300 | $4,410 | $25,890 |
| 2017 | $1,724 | $27,810 | $5,500 | $22,310 |
| 2016 | $1,711 | $27,810 | $5,500 | $22,310 |
| 2015 | $1,614 | $27,810 | $5,500 | $22,310 |
| 2014 | $1,540 | $26,610 | $5,260 | $21,350 |
| 2013 | $1,529 | $26,610 | $5,260 | $21,350 |
Source: Public Records
Map
Nearby Homes
- 2119 E 41st St
- V/L Grove Ave
- 3934 Gary Ave
- 4223 Palm Ave
- V/L Clinton Ave
- 1951 E 39th St
- 4411 Tacoma Ave
- 4217 Camden Ave
- 4721 Andover Ave
- 3641 Tacoma Ave
- 2217 E 32nd St
- 4429 Norfolk Ave
- 2440 E 32nd St
- 4434 Riverside Dr
- 1924 E 33rd St
- 4510 Riverside Dr
- VL Ridgewood St
- 2066 E 30th St
- 3308 Norfolk Ave
- 5196 Farr Ave
- 4123 Denison Ave
- 4119 Denison Ave
- 2156 E 42nd St
- 4115 Denison Ave
- 4118 Denison Ave
- 2152 E 42nd St
- 4111 Denison Ave
- 2151 E 42nd St
- 2217 E 42nd St
- 2148 E 42nd St
- 2156 E 41st St
- 4105 Denison Ave
- 2147 E 42nd St
- 2152 E 41st St
- 2144 E 42nd St
- 2143 E 42nd St
- 2148 E 41st St
- V/L E 41st St
- 4101 Denison Ave
- 2140 E 42nd St
Your Personal Tour Guide
Ask me questions while you tour the home.