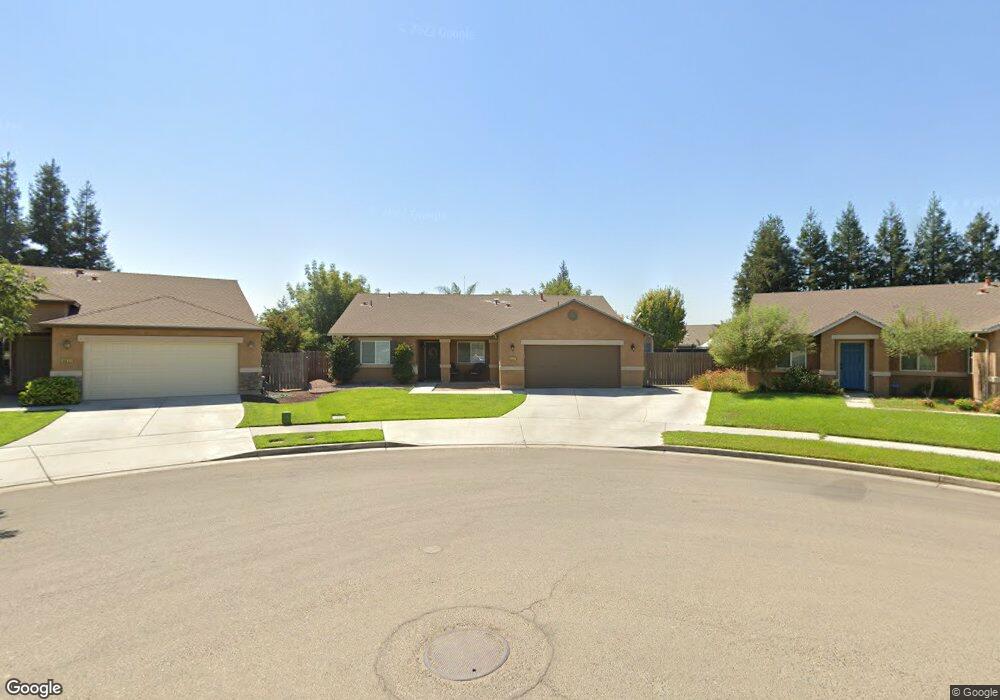
4127 S Noyes St Visalia, CA 93277
Estimated Value: $410,000 - $433,760
3
Beds
2
Baths
1,689
Sq Ft
$251/Sq Ft
Est. Value
About This Home
This home is located at 4127 S Noyes St, Visalia, CA 93277 and is currently estimated at $424,190, approximately $251 per square foot. 4127 S Noyes St is a home located in Tulare County with nearby schools including Cottonwood Creek Elementary School, La Joya Middle School, and El Diamante High School.
Ownership History
Date
Name
Owned For
Owner Type
Purchase Details
Closed on
Jan 15, 2020
Sold by
Ferreira Shelly Lynn
Bought by
Ferreira Frank A
Current Estimated Value
Home Financials for this Owner
Home Financials are based on the most recent Mortgage that was taken out on this home.
Original Mortgage
$220,000
Outstanding Balance
$194,864
Interest Rate
3.73%
Mortgage Type
New Conventional
Estimated Equity
$229,326
Purchase Details
Closed on
Nov 28, 2011
Sold by
Kutil Lonnie
Bought by
Ferreira Frank A
Home Financials for this Owner
Home Financials are based on the most recent Mortgage that was taken out on this home.
Original Mortgage
$148,146
Interest Rate
4.25%
Mortgage Type
FHA
Purchase Details
Closed on
Jan 3, 2007
Sold by
Centex Homes
Bought by
Kutil Lonnie and Kutil Jennifer
Home Financials for this Owner
Home Financials are based on the most recent Mortgage that was taken out on this home.
Original Mortgage
$246,941
Interest Rate
6.87%
Mortgage Type
New Conventional
Create a Home Valuation Report for This Property
The Home Valuation Report is an in-depth analysis detailing your home's value as well as a comparison with similar homes in the area
Purchase History
| Date | Buyer | Sale Price | Title Company |
|---|---|---|---|
| Ferreira Frank A | -- | Chicago Title Company | |
| Ferreira Frank A | $152,000 | Chicago Title Company | |
| Kutil Lonnie | $291,000 | Commerce Title Company |
Source: Public Records
Mortgage History
| Date | Status | Borrower | Loan Amount |
|---|---|---|---|
| Open | Ferreira Frank A | $220,000 | |
| Closed | Ferreira Frank A | $148,146 | |
| Previous Owner | Kutil Lonnie | $246,941 |
Source: Public Records
Tax History
| Year | Tax Paid | Tax Assessment Tax Assessment Total Assessment is a certain percentage of the fair market value that is determined by local assessors to be the total taxable value of land and additions on the property. | Land | Improvement |
|---|---|---|---|---|
| 2025 | $2,307 | $226,043 | $56,521 | $169,522 |
| 2024 | $2,307 | $191,612 | $55,413 | $136,199 |
| 2023 | $2,250 | $187,856 | $54,327 | $133,529 |
| 2022 | $2,161 | $184,173 | $53,262 | $130,911 |
| 2021 | $2,163 | $180,562 | $52,218 | $128,344 |
| 2020 | $2,146 | $178,711 | $51,683 | $127,028 |
| 2019 | $2,093 | $175,207 | $50,670 | $124,537 |
| 2018 | $2,003 | $167,793 | $49,675 | $118,118 |
| 2017 | $1,964 | $164,503 | $48,701 | $115,802 |
| 2016 | $1,931 | $161,277 | $47,746 | $113,531 |
| 2015 | $1,882 | $158,855 | $47,029 | $111,826 |
| 2014 | $1,882 | $155,743 | $46,108 | $109,635 |
Source: Public Records
Map
Nearby Homes
- 3939 S Crenshaw St
- 3433 W Milan Ave
- 27387 Road 100
- 5411 W Mission Ave
- 4918 W Chestnut Ave
- 5019 W Dorothea Ave
- 3346 W Good Ave
- 3345 W Florence Ave
- 3103 S Avocado St Unit 54
- 4222 W Dorothea Ave
- 4302 S Chatham St
- 4247 S University St
- 5212 W La Vida Ave Unit 9
- 4245 S Silvervale St
- 4231 S Silvervale St
- 4250 S Silvervale St
- 4411 S Ernest St
- 3432 W Good Ave
- 3412 W Venice Ave
- 3749 S University St
- 4821 W Greenhouse Ave
- 4115 S Noyes St
- 4128 S Crenshaw St
- 4132 S Crenshaw St
- 4832 W Elkhorn Ave
- 4116 S Crenshaw St
- 4826 W Elkhorn Ave
- 4811 W Greenhouse Ave
- 4840 W Elkhorn Ave
- 4103 S Noyes St
- 4852 W Elkhorn Ave
- 4818 W Elkhorn Ave
- 4104 S Crenshaw St
- 4801 W Greenhouse Ave
- 4810 W Elkhorn Ave
- 4133 S Crenshaw St
- 4129 S Crenshaw St
- 4737 W Greenhouse Ave
- 4800 W Elkhorn Ave
- 4149 S Crenshaw St
Your Personal Tour Guide
Ask me questions while you tour the home.