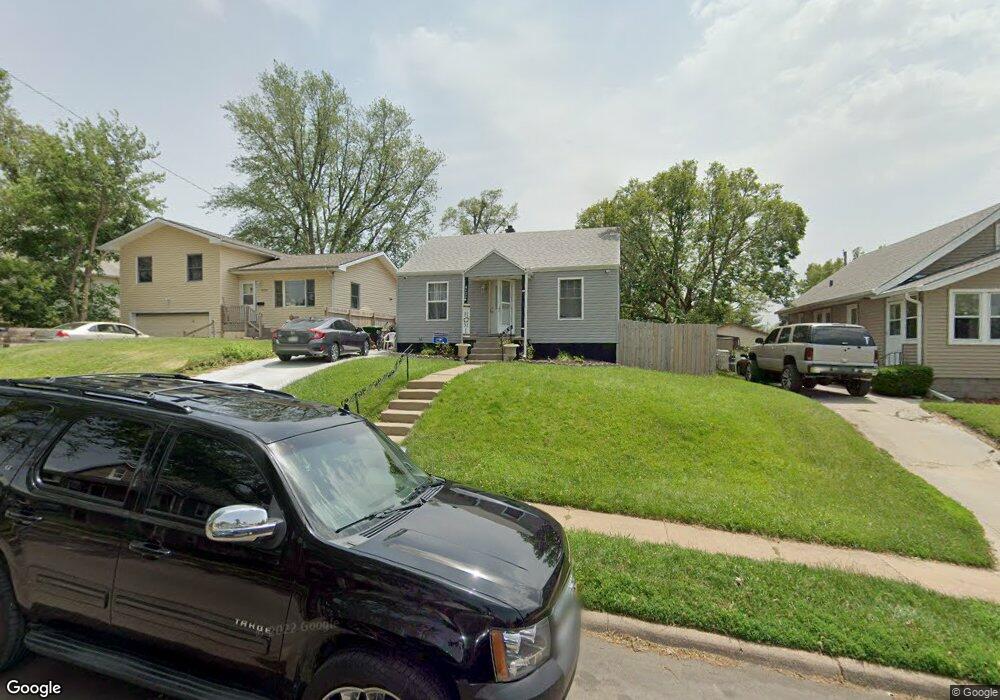
4127 X St Omaha, NE 68107
South Central Omaha NeighborhoodEstimated Value: $150,000 - $162,000
2
Beds
1
Bath
909
Sq Ft
$172/Sq Ft
Est. Value
About This Home
This home is located at 4127 X St, Omaha, NE 68107 and is currently estimated at $156,743, approximately $172 per square foot. 4127 X St is a home located in Douglas County with nearby schools including Gateway Elementary School, Bryan High School, and Sts. Peter and Paul School.
Ownership History
Date
Name
Owned For
Owner Type
Purchase Details
Closed on
Oct 30, 2009
Sold by
Crase James
Bought by
Marquez Berenice
Current Estimated Value
Purchase Details
Closed on
Sep 13, 2001
Sold by
Eads Pamela Kay
Bought by
Crase James
Home Financials for this Owner
Home Financials are based on the most recent Mortgage that was taken out on this home.
Original Mortgage
$41,000
Interest Rate
6.88%
Create a Home Valuation Report for This Property
The Home Valuation Report is an in-depth analysis detailing your home's value as well as a comparison with similar homes in the area
Home Values in the Area
Average Home Value in this Area
Purchase History
| Date | Buyer | Sale Price | Title Company |
|---|---|---|---|
| Marquez Berenice | $65,000 | -- | |
| Crase James | $38,000 | -- |
Source: Public Records
Mortgage History
| Date | Status | Borrower | Loan Amount |
|---|---|---|---|
| Previous Owner | Crase James | $41,000 |
Source: Public Records
Tax History
| Year | Tax Paid | Tax Assessment Tax Assessment Total Assessment is a certain percentage of the fair market value that is determined by local assessors to be the total taxable value of land and additions on the property. | Land | Improvement |
|---|---|---|---|---|
| 2025 | $1,685 | $113,100 | $12,200 | $100,900 |
| 2024 | $2,198 | $104,200 | $12,200 | $92,000 |
| 2023 | $2,198 | $104,200 | $12,200 | $92,000 |
| 2022 | $1,876 | $87,900 | $6,400 | $81,500 |
| 2021 | $1,615 | $76,300 | $6,400 | $69,900 |
| 2020 | $1,634 | $76,300 | $6,400 | $69,900 |
| 2019 | $1,353 | $63,000 | $6,400 | $56,600 |
| 2018 | $1,325 | $61,600 | $6,400 | $55,200 |
| 2017 | $1,331 | $61,600 | $6,400 | $55,200 |
| 2016 | $1,322 | $61,600 | $6,400 | $55,200 |
Source: Public Records
Map
Nearby Homes
Your Personal Tour Guide
Ask me questions while you tour the home.