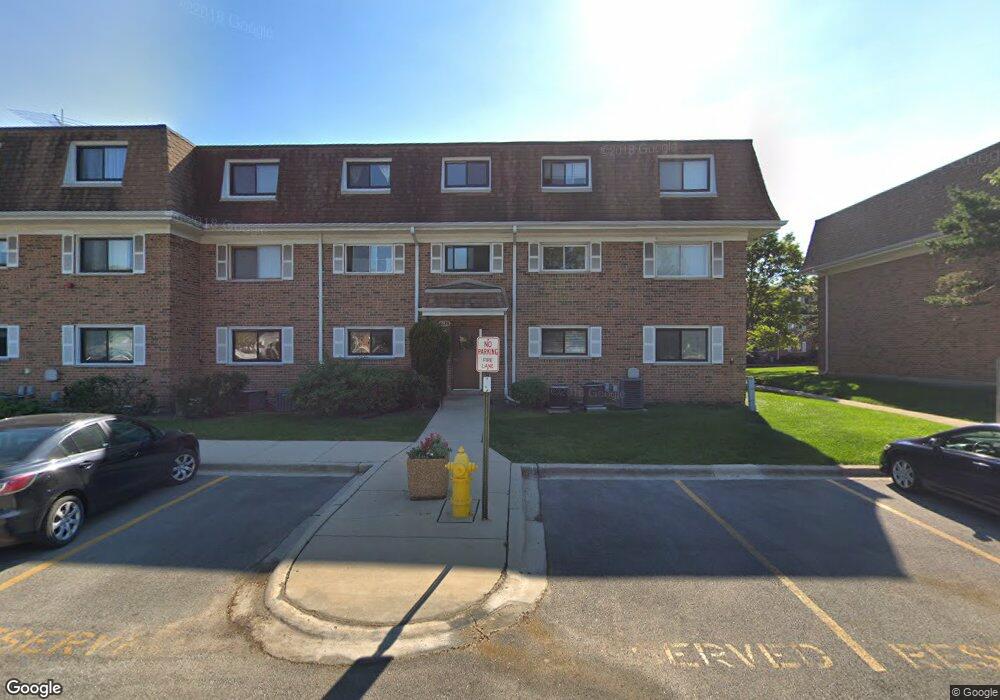
4128 Cove Ln Unit 4128C Glenview, IL 60025
Estimated Value: $236,405 - $246,000
2
Beds
--
Bath
1,100
Sq Ft
$219/Sq Ft
Est. Value
About This Home
This home is located at 4128 Cove Ln Unit 4128C, Glenview, IL 60025 and is currently estimated at $240,351, approximately $218 per square foot. 4128 Cove Ln Unit 4128C is a home located in Cook County with nearby schools including Westbrook Elementary School, Glen Grove Elementary School, and Springman Middle School.
Ownership History
Date
Name
Owned For
Owner Type
Purchase Details
Closed on
Sep 11, 2014
Sold by
Yoon Hae Y and Jung You J
Bought by
Yoon Hae Y
Current Estimated Value
Purchase Details
Closed on
Dec 28, 2000
Sold by
Yoon Ji Ho and Yoon Kwangja
Bought by
Jung You J and Yoon Hae Y
Home Financials for this Owner
Home Financials are based on the most recent Mortgage that was taken out on this home.
Original Mortgage
$95,000
Outstanding Balance
$35,636
Interest Rate
7.77%
Estimated Equity
$204,715
Purchase Details
Closed on
Feb 8, 1996
Sold by
Yoon Ji Ho
Bought by
Yoon Ji Ho and Yoon Kwangja
Purchase Details
Closed on
Nov 30, 1995
Sold by
Ipjian John D and Ipjian Mary K
Bought by
Yoon Ji Ho
Home Financials for this Owner
Home Financials are based on the most recent Mortgage that was taken out on this home.
Original Mortgage
$68,000
Interest Rate
7.44%
Create a Home Valuation Report for This Property
The Home Valuation Report is an in-depth analysis detailing your home's value as well as a comparison with similar homes in the area
Home Values in the Area
Average Home Value in this Area
Purchase History
| Date | Buyer | Sale Price | Title Company |
|---|---|---|---|
| Yoon Hae Y | -- | None Available | |
| Jung You J | $125,000 | Chicago Title Insurance Co | |
| Yoon Ji Ho | -- | -- | |
| Yoon Ji Ho | $138,000 | 1St American Title |
Source: Public Records
Mortgage History
| Date | Status | Borrower | Loan Amount |
|---|---|---|---|
| Open | Jung You J | $95,000 | |
| Closed | Yoon Ji Ho | $68,000 |
Source: Public Records
Tax History Compared to Growth
Tax History
| Year | Tax Paid | Tax Assessment Tax Assessment Total Assessment is a certain percentage of the fair market value that is determined by local assessors to be the total taxable value of land and additions on the property. | Land | Improvement |
|---|---|---|---|---|
| 2024 | $2,757 | $15,719 | $1,729 | $13,990 |
| 2023 | $2,658 | $15,719 | $1,729 | $13,990 |
| 2022 | $2,658 | $15,719 | $1,729 | $13,990 |
| 2021 | $2,381 | $12,843 | $1,178 | $11,665 |
| 2020 | $2,409 | $12,843 | $1,178 | $11,665 |
| 2019 | $2,267 | $14,235 | $1,178 | $13,057 |
| 2018 | $1,622 | $10,441 | $1,021 | $9,420 |
| 2017 | $1,593 | $10,441 | $1,021 | $9,420 |
| 2016 | $1,691 | $10,441 | $1,021 | $9,420 |
| 2015 | $1,192 | $7,598 | $824 | $6,774 |
| 2014 | $1,183 | $7,598 | $824 | $6,774 |
| 2013 | $1,134 | $7,598 | $824 | $6,774 |
Source: Public Records
Map
Nearby Homes
- 4170 Cove Ln Unit 2B
- 10385 Dearlove Rd Unit 1I
- 1018 Castilian Ct Unit A205
- 10347 Dearlove Rd Unit 302
- 1026 Castilian Ct Unit D162
- 4004 Denice Ct Unit 3
- 625 Quincy Bridge Ln Unit 301
- 917 Tamer Ln
- 701 Forum Square Unit 609
- 4150 Central Rd Unit 3E
- 3732 Capri Ct Unit T18A
- 600 Naples Ct Unit 510
- 600 Naples Ct Unit 107
- 600 Naples Ct Unit 608
- 1223 Milwaukee Ave
- 9517 W Central Rd
- 3505 Linneman St
- 10009 Meadow Ln
- 9411 Harrison St Unit 471494
- 533 Cherry Ln
- 4128 Cove Ln Unit 4128B
- 4128 Cove Ln Unit 4128D
- 4128 Cove Ln Unit 4128A
- 4128 Cove Ln Unit 4128E
- 4128 Cove Ln Unit 4128F
- 4128 Cove Ln Unit A
- 4128 Cove Ln Unit F
- 4126 Cove Ln Unit 4126D
- 4126 Cove Ln Unit 4126A
- 4126 Cove Ln Unit 4126C
- 4126 Cove Ln Unit 4126E
- 4126 Cove Ln Unit 4126B
- 4126 Cove Ln Unit 4126F
- 4126 Cove Ln Unit C
- 4126 Cove Ln Unit D
- 4126 Cove Ln Unit F
- 4126 Cove Ln Unit A
- 4126 Cove Ln Unit B
- 4130 Cove Ln Unit 3C
- 4130 Cove Ln Unit 4130F