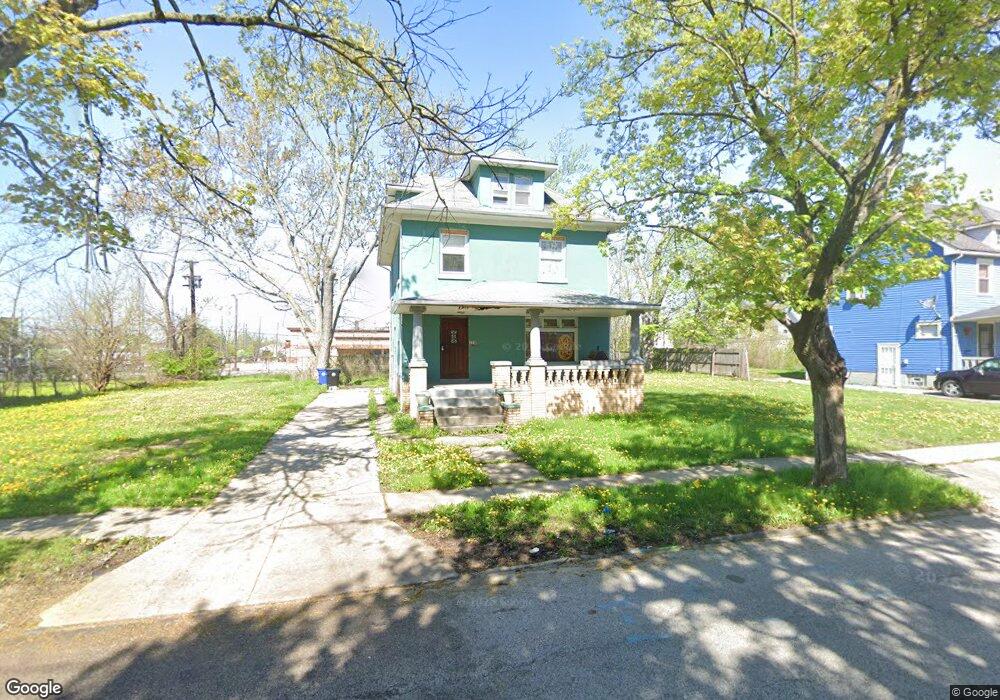
4128 E 135th St Cleveland, OH 44105
Corlett NeighborhoodEstimated Value: $71,151 - $143,000
4
Beds
1
Bath
1,553
Sq Ft
$62/Sq Ft
Est. Value
About This Home
This home is located at 4128 E 135th St, Cleveland, OH 44105 and is currently estimated at $97,038, approximately $62 per square foot. 4128 E 135th St is a home located in Cuyahoga County with nearby schools including Andrew J. Rickoff School, Adlai Stevenson School, and Anton Grdina School.
Ownership History
Date
Name
Owned For
Owner Type
Purchase Details
Closed on
Apr 8, 2011
Sold by
Cuyahoga County
Bought by
Smith Shaprice
Current Estimated Value
Purchase Details
Closed on
Sep 29, 2006
Sold by
Freedom Investment Group Llc
Bought by
Head Dante R
Home Financials for this Owner
Home Financials are based on the most recent Mortgage that was taken out on this home.
Original Mortgage
$86,400
Interest Rate
9.12%
Mortgage Type
Purchase Money Mortgage
Purchase Details
Closed on
Mar 9, 2006
Sold by
Jp Morgan Chase Bank
Bought by
Freedom Investment Group Llc
Purchase Details
Closed on
Sep 20, 2005
Sold by
Tatum Kathreen
Bought by
Jpmorgan Chase Bank and Imc Home Equity Loan Trust 1998-3
Purchase Details
Closed on
Mar 17, 1998
Sold by
Estate Of Theodis Tatum
Bought by
Tatum Kathreen
Purchase Details
Closed on
Jan 1, 1975
Bought by
Tatum Theodis and Tatum Kethreen
Create a Home Valuation Report for This Property
The Home Valuation Report is an in-depth analysis detailing your home's value as well as a comparison with similar homes in the area
Home Values in the Area
Average Home Value in this Area
Purchase History
| Date | Buyer | Sale Price | Title Company |
|---|---|---|---|
| Smith Shaprice | $300 | Public | |
| Head Dante R | $96,000 | Mountaineer Title Agency | |
| Freedom Investment Group Llc | $25,000 | Rta | |
| Jpmorgan Chase Bank | $34,667 | Attorney | |
| Tatum Kathreen | -- | -- | |
| Tatum Theodis | -- | -- |
Source: Public Records
Mortgage History
| Date | Status | Borrower | Loan Amount |
|---|---|---|---|
| Previous Owner | Head Dante R | $86,400 |
Source: Public Records
Tax History Compared to Growth
Tax History
| Year | Tax Paid | Tax Assessment Tax Assessment Total Assessment is a certain percentage of the fair market value that is determined by local assessors to be the total taxable value of land and additions on the property. | Land | Improvement |
|---|---|---|---|---|
| 2024 | $1,080 | $20,580 | $4,410 | $16,170 |
| 2023 | $343 | $13,690 | $3,260 | $10,430 |
| 2022 | $932 | $13,685 | $3,255 | $10,430 |
| 2021 | $369 | $13,690 | $3,260 | $10,430 |
| 2020 | $263 | $11,800 | $2,800 | $9,000 |
| 2019 | $244 | $33,700 | $8,000 | $25,700 |
| 2018 | $232 | $11,800 | $2,800 | $9,000 |
| 2017 | $223 | $11,450 | $2,590 | $8,860 |
| 2016 | $221 | $11,450 | $2,590 | $8,860 |
| 2015 | $3,697 | $11,450 | $2,590 | $8,860 |
| 2014 | $3,697 | $13,480 | $3,050 | $10,430 |
Source: Public Records
Map
Nearby Homes
- 13406 Ferris Ave
- 13414 Ferris Ave
- 4526 E 131st St
- 13001 Ferris Ave
- 12900 Ferris Ave
- 12822 Ferris Ave
- 13207 Crennell Ave
- 4286 E 133rd St
- 12716 Harvard Ave
- 4239 E 128th St
- 4226 E 128th St
- 13613 Beachwood Ave
- 12810 Benwood Ave
- 4302 E 131st St
- 12503 Marston Ave
- 13609 Edgewood Ave
- 13302 Durkee Ave
- 12413 Ferris Ave
- 4297 E 139th St
- 13801 Edgewood Ave
- 4134 E 135th St
- 4124 E 135th St
- 4136 E 135th St
- 4120 E 135th St
- 4140 E 135th St
- 4116 E 135th St
- 4144 E 135th St
- 4129 E 135th St
- 4125 E 135th St
- 4133 E 135th St
- 4137 E 135th St
- 4121 E 135th St
- 4141 E 135th St
- 4117 E 135th St
- 4145 E 135th St
- 13309 Marston Ave
- 13401 Marston Ave
- 13317 Marston Ave
- 13405 Marston Ave
- 13313 Marston Ave