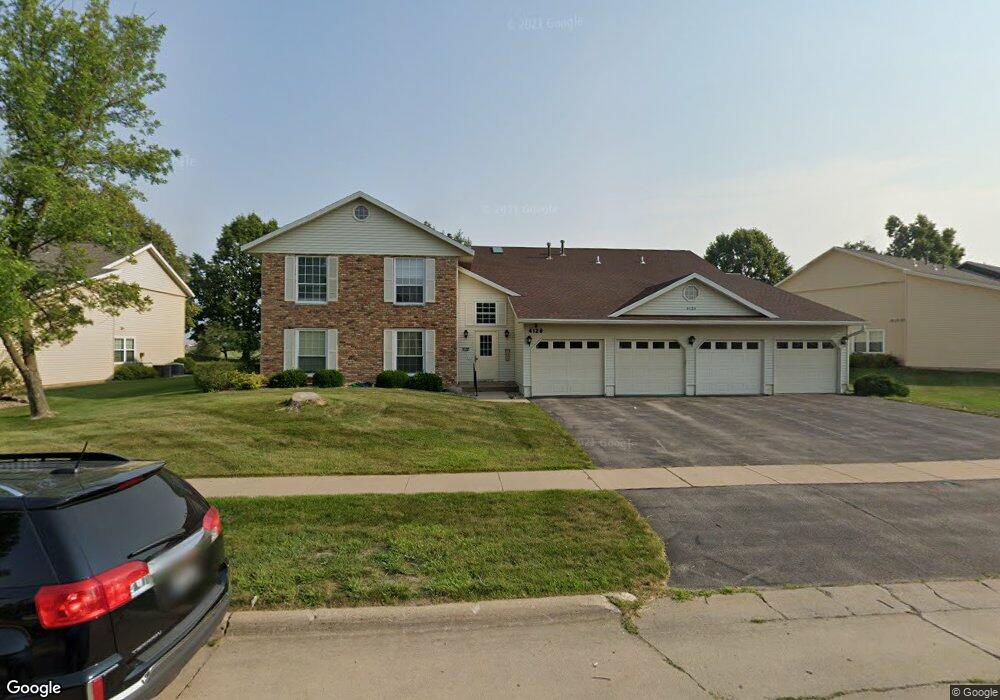
4128 Lexington Dr NE Unit C Cedar Rapids, IA 52402
Estimated Value: $145,000 - $164,000
2
Beds
2
Baths
1,147
Sq Ft
$132/Sq Ft
Est. Value
About This Home
This home is located at 4128 Lexington Dr NE Unit C, Cedar Rapids, IA 52402 and is currently estimated at $150,937, approximately $131 per square foot. 4128 Lexington Dr NE Unit C is a home located in Linn County with nearby schools including Ponderosa Elementary School, Pierce Elementary School, and Franklin Middle School.
Ownership History
Date
Name
Owned For
Owner Type
Purchase Details
Closed on
Jun 5, 2024
Sold by
Brekke Sandra
Bought by
Brekke Shane W and Zierke Kim K
Current Estimated Value
Purchase Details
Closed on
Jan 4, 2018
Sold by
Moss Richard Alan
Bought by
Brekke Sandra
Home Financials for this Owner
Home Financials are based on the most recent Mortgage that was taken out on this home.
Original Mortgage
$59,900
Interest Rate
3.5%
Mortgage Type
Adjustable Rate Mortgage/ARM
Purchase Details
Closed on
Jan 10, 2003
Sold by
Moss Howard U and Moss Arlene L
Bought by
Havlicek John R and Havlicek Joyce A
Purchase Details
Closed on
Nov 1, 2002
Sold by
Shaw Sherry P
Bought by
Moss Howard U and Moss Arlene L
Create a Home Valuation Report for This Property
The Home Valuation Report is an in-depth analysis detailing your home's value as well as a comparison with similar homes in the area
Home Values in the Area
Average Home Value in this Area
Purchase History
| Date | Buyer | Sale Price | Title Company |
|---|---|---|---|
| Brekke Shane W | -- | None Listed On Document | |
| Brekke Shane W | -- | None Listed On Document | |
| Brekke Sandra | $110,000 | None Available | |
| Havlicek John R | $83,500 | -- | |
| Moss Howard U | $97,000 | -- |
Source: Public Records
Mortgage History
| Date | Status | Borrower | Loan Amount |
|---|---|---|---|
| Previous Owner | Brekke Sandra | $59,900 |
Source: Public Records
Tax History Compared to Growth
Tax History
| Year | Tax Paid | Tax Assessment Tax Assessment Total Assessment is a certain percentage of the fair market value that is determined by local assessors to be the total taxable value of land and additions on the property. | Land | Improvement |
|---|---|---|---|---|
| 2025 | $2,158 | $147,100 | $19,000 | $128,100 |
| 2024 | $2,322 | $140,600 | $19,000 | $121,600 |
| 2023 | $2,322 | $139,400 | $19,000 | $120,400 |
| 2022 | $2,256 | $119,000 | $16,000 | $103,000 |
| 2021 | $2,372 | $117,900 | $16,000 | $101,900 |
| 2020 | $2,372 | $116,100 | $16,000 | $100,100 |
| 2019 | $2,180 | $109,700 | $16,000 | $93,700 |
| 2018 | $2,100 | $109,700 | $16,000 | $93,700 |
| 2017 | $2,150 | $107,200 | $8,000 | $99,200 |
| 2016 | $2,191 | $103,100 | $8,000 | $95,100 |
| 2015 | $2,233 | $104,975 | $8,000 | $96,975 |
| 2014 | $2,048 | $104,975 | $8,000 | $96,975 |
| 2013 | $2,000 | $104,975 | $8,000 | $96,975 |
Source: Public Records
Map
Nearby Homes
- 4113 Lexington Ct NE Unit C
- 4113 Lexington Ct NE Unit A
- 3915 Lexington Dr NE Unit B
- 4131 Blue Jay Dr NE Unit A
- 4131 Blue Jay Dr NE Unit C
- 3608 Foxborough Terrace NE Unit B
- 3607 Foxborough Terrace NE Unit A
- 3524 Swallow Ct NE
- 4113 Lark Ct NE Unit 4113
- 4417 Twin Pine Dr NE
- 4010 Red Cedar Dr NE Unit B
- 5230 Edgewood Rd NE
- 4433 Coventry Ln NE
- 3920 Wyndham Dr NE
- 3719 Blue Mound Dr NE
- 4545 Westchester Dr NE Unit D
- 4645 Westchester Dr NE Unit A
- 4460 Westchester Dr NE Unit C
- 4745 Westchester Dr NE Unit A
- 3604 Heatheridge Dr NE
- 4128 Lexington Dr NE Unit A
- 4128 Lexington Dr NE Unit C
- 4128 Lexington Dr NE Unit B
- 4128 Lexington Dr NE
- 4128 Lexington Dr NE Unit D
- 4122 Lexington Dr NE Unit C
- 4122 Lexington Dr NE Unit B
- 4122 Lexington Dr NE Unit B
- 4122 Lexington Dr NE
- 4122 Lexington Dr NE Unit D
- 4122 Lexington Dr NE Unit A
- 4132 Lexington Dr NE
- 4132 Lexington Dr NE Unit 4132
- 4132 Lexington Dr NE Unit A
- 4132 Lexington Dr NE Unit D
- 4132 Lexington Dr NE Unit C
- 4132 Lexington Dr NE Unit B
- 4127 Lexington Dr NE
- 4127 Lexington Dr NE
- 4127 Lexington Dr NE