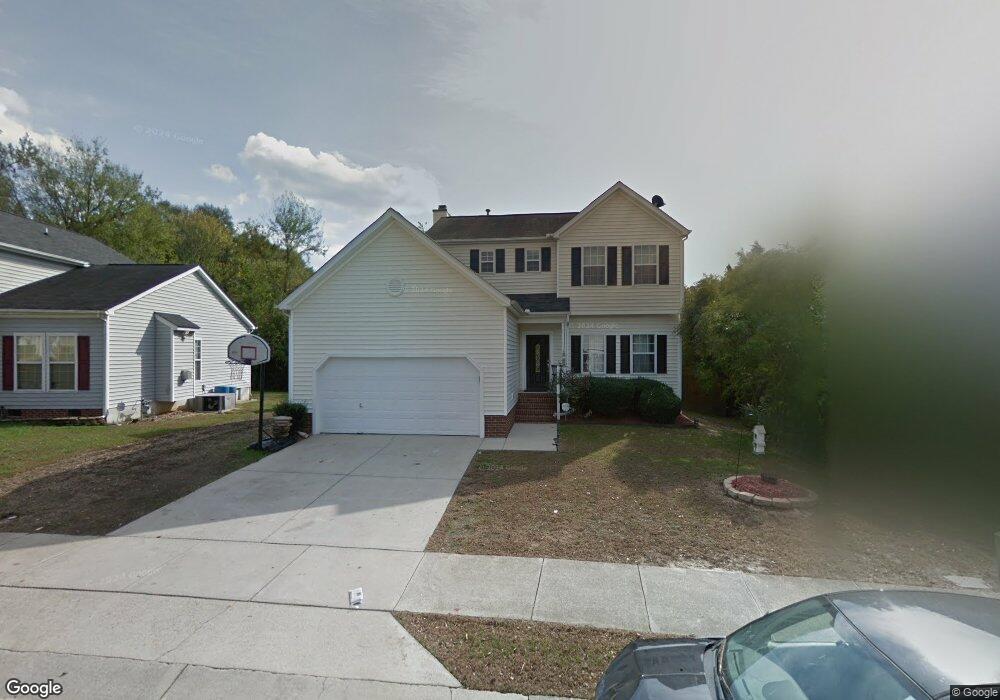
4128 Mantua Way Raleigh, NC 27604
Northeast Raleigh NeighborhoodEstimated Value: $348,000 - $372,000
3
Beds
3
Baths
1,624
Sq Ft
$222/Sq Ft
Est. Value
About This Home
This home is located at 4128 Mantua Way, Raleigh, NC 27604 and is currently estimated at $360,490, approximately $221 per square foot. 4128 Mantua Way is a home located in Wake County with nearby schools including Wilburn Elementary, Durant Road Middle, and Millbrook High School.
Ownership History
Date
Name
Owned For
Owner Type
Purchase Details
Closed on
Mar 31, 2010
Sold by
Johnson Melvin D and Johnson Emily L
Bought by
Lopez Erika
Current Estimated Value
Home Financials for this Owner
Home Financials are based on the most recent Mortgage that was taken out on this home.
Original Mortgage
$162,000
Outstanding Balance
$107,415
Interest Rate
4.91%
Mortgage Type
New Conventional
Estimated Equity
$253,075
Purchase Details
Closed on
Mar 28, 2005
Sold by
Baker Kilt P and Baker Shannon M Keaton
Bought by
Johnson Melvin D and Johnson Emily L
Home Financials for this Owner
Home Financials are based on the most recent Mortgage that was taken out on this home.
Original Mortgage
$146,585
Interest Rate
5.54%
Mortgage Type
VA
Purchase Details
Closed on
Dec 18, 1998
Sold by
M/I Schottenstein Homes Inc
Bought by
Baker Kilt P and Keaton Shannon M
Home Financials for this Owner
Home Financials are based on the most recent Mortgage that was taken out on this home.
Original Mortgage
$128,907
Interest Rate
6.9%
Mortgage Type
FHA
Create a Home Valuation Report for This Property
The Home Valuation Report is an in-depth analysis detailing your home's value as well as a comparison with similar homes in the area
Home Values in the Area
Average Home Value in this Area
Purchase History
| Date | Buyer | Sale Price | Title Company |
|---|---|---|---|
| Lopez Erika | $162,000 | None Available | |
| Johnson Melvin D | $143,500 | -- | |
| Baker Kilt P | $133,000 | -- |
Source: Public Records
Mortgage History
| Date | Status | Borrower | Loan Amount |
|---|---|---|---|
| Open | Lopez Erika | $162,000 | |
| Previous Owner | Johnson Melvin D | $146,585 | |
| Previous Owner | Baker Kilt P | $128,907 |
Source: Public Records
Tax History Compared to Growth
Tax History
| Year | Tax Paid | Tax Assessment Tax Assessment Total Assessment is a certain percentage of the fair market value that is determined by local assessors to be the total taxable value of land and additions on the property. | Land | Improvement |
|---|---|---|---|---|
| 2025 | $3,202 | $364,892 | $90,000 | $274,892 |
| 2024 | $3,189 | $364,892 | $90,000 | $274,892 |
| 2023 | $2,388 | $217,265 | $42,000 | $175,265 |
| 2022 | $2,220 | $217,265 | $42,000 | $175,265 |
| 2021 | $2,134 | $217,265 | $42,000 | $175,265 |
| 2020 | $2,095 | $217,265 | $42,000 | $175,265 |
| 2019 | $1,917 | $163,726 | $30,000 | $133,726 |
| 2018 | $1,809 | $163,726 | $30,000 | $133,726 |
| 2017 | $1,723 | $163,726 | $30,000 | $133,726 |
| 2016 | $1,688 | $163,726 | $30,000 | $133,726 |
| 2015 | $1,709 | $163,075 | $28,000 | $135,075 |
| 2014 | $1,621 | $163,075 | $28,000 | $135,075 |
Source: Public Records
Map
Nearby Homes
- 4120 Standing Rock Way
- 4217 Toccopola St
- 4236 Tensity Dr
- 4213 Tensity Dr
- 4221 Tensity Dr
- 4232 Palafox Ct
- 4212 Beacon Crest Way
- 2400 Dorety Place
- Wyatt Plan at Elm Grove - Club Collection
- 2109 Woodwyck Way
- 1431 Beacon Village Dr
- 2415 Dorety Place
- 4608 Dresden Village Dr
- Jackson Plan at Elm Grove - City Collection
- 3711 Elm Grove Ln
- 4608 Mowbray Dr
- 3615 Elm Grove Ln
- 1340 Beacon Village Dr
- 4401 Liverpool Ln
- 4412 Birmingham Way
- 4124 Mantua Way
- 4132 Mantua Way
- 4136 Mantua Way
- 4017 Live Oak Rd
- 4013 Live Oak Rd
- 4131 Mantua Way
- 4125 Mantua Way
- 4115 Mantua Way
- 4135 Mantua Way
- 4112 Mantua Way
- 2105 Glassville
- 4021 Live Oak Rd
- 2111 Glassville
- 4009 Live Oak Rd
- 4109 Mantua Way
- 4141 Mantua Way
- 4106 Standing Rock Way
- 4104 Standing Rock Way
- 4100 Standing Rock Way
- 2101 Glassville