Estimated Value: $785,000 - $1,030,131
4
Beds
3
Baths
2,795
Sq Ft
$327/Sq Ft
Est. Value
About This Home
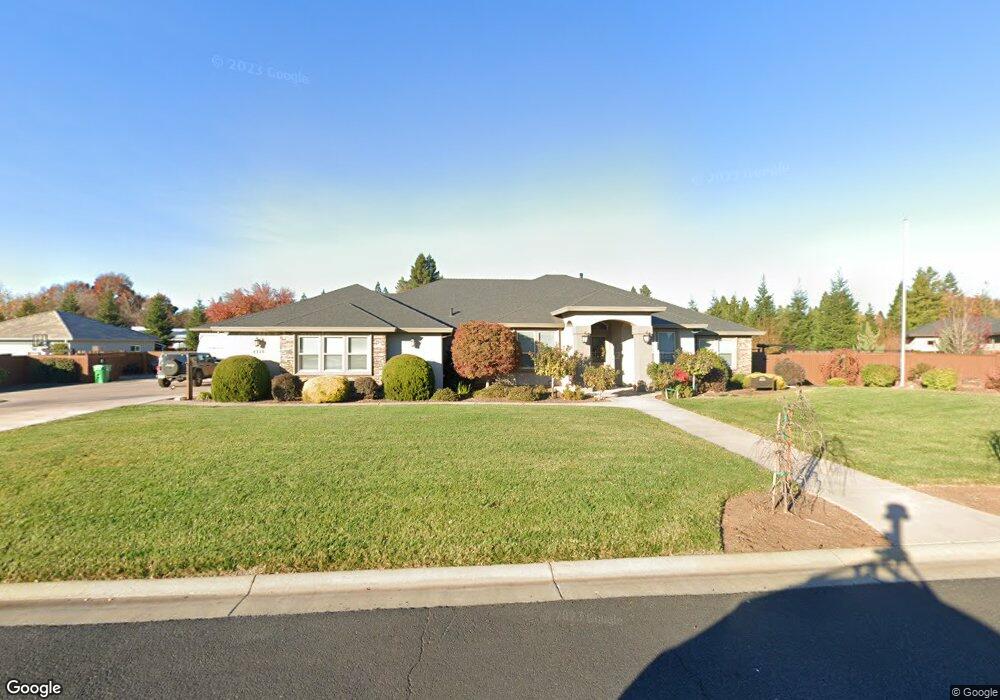
This home is located at 4128 Tiberon Way, Chico, CA 95973 and is currently estimated at $914,283, approximately $327 per square foot. 4128 Tiberon Way is a home located in Butte County with nearby schools including Shasta Elementary School, Bidwell Junior High School, and Pleasant Valley High School.
Ownership History
Date
Name
Owned For
Owner Type
Purchase Details
Closed on
Jul 27, 2016
Sold by
Mickelson Carole L
Bought by
Mickelson Carole L
Current Estimated Value
Purchase Details
Closed on
Jun 6, 2016
Sold by
Mickelson Carole L and Doll Leslie C
Bought by
Mickelson Carole L and Doll Leslie C
Purchase Details
Closed on
Jan 12, 2015
Sold by
Larry Porter Construction
Bought by
Mickelson Carole L and Doll Leslie C
Home Financials for this Owner
Home Financials are based on the most recent Mortgage that was taken out on this home.
Original Mortgage
$390,000
Interest Rate
3.82%
Mortgage Type
New Conventional
Purchase Details
Closed on
Feb 18, 2014
Sold by
Nunley David L and Nunley Donna A
Bought by
Larry Porter Construction
Purchase Details
Closed on
Jun 18, 2010
Sold by
Marcon Inc
Bought by
Nunley David L and Nunley Donna A
Create a Home Valuation Report for This Property
The Home Valuation Report is an in-depth analysis detailing your home's value as well as a comparison with similar homes in the area
Home Values in the Area
Average Home Value in this Area
Purchase History
| Date | Buyer | Sale Price | Title Company |
|---|---|---|---|
| Mickelson Carole L | -- | None Available | |
| Mickelson Carole L | -- | None Available | |
| Mickelson Carole L | -- | Mid Valley Title & Escrow Co | |
| Mickelson Carole L | $590,000 | Mid Valley Title & Escrow Co | |
| Larry Porter Construction | $130,000 | Mid Valley Title & Escrow Co | |
| Nunley David L | $140,000 | Mid Valley Title & Escrow Co |
Source: Public Records
Mortgage History
| Date | Status | Borrower | Loan Amount |
|---|---|---|---|
| Previous Owner | Mickelson Carole L | $390,000 |
Source: Public Records
Tax History Compared to Growth
Tax History
| Year | Tax Paid | Tax Assessment Tax Assessment Total Assessment is a certain percentage of the fair market value that is determined by local assessors to be the total taxable value of land and additions on the property. | Land | Improvement |
|---|---|---|---|---|
| 2025 | $8,760 | $788,356 | $220,274 | $568,082 |
| 2024 | $8,760 | $772,899 | $215,955 | $556,944 |
| 2023 | $8,658 | $757,745 | $211,721 | $546,024 |
| 2022 | $8,523 | $742,888 | $207,570 | $535,318 |
| 2021 | $8,366 | $728,322 | $203,500 | $524,822 |
| 2020 | $8,343 | $720,855 | $201,414 | $519,441 |
| 2019 | $8,195 | $706,721 | $197,465 | $509,256 |
| 2018 | $8,015 | $692,865 | $193,594 | $499,271 |
| 2017 | $7,858 | $679,281 | $189,799 | $489,482 |
| 2016 | $7,224 | $668,997 | $182,745 | $486,252 |
| 2015 | $5,600 | $510,597 | $132,597 | $378,000 |
| 2014 | $1,624 | $130,000 | $130,000 | $0 |
Source: Public Records
Map
Nearby Homes
- 13962 Lindbergh Cir
- 14034 Limousin Dr
- 55 Roseanna Ct
- 24 Roseanna Ct
- 10 Roseanna Ct
- 13951 Caribbean Way
- 13966 Carriage Estates Way
- 4301 Stable Ln
- 4298 Keith Ln
- 4269 Keith Ln
- 63 Our Way
- 34 Covey Ct
- 0 Garner Ln
- 11 Hawk Place
- 14450 Meridian Rd
- 131 Skycreek Ct
- 141 Skycreek Ct
- 110 Three Oaks Ct
- 130 Three Oaks Ct
- 101 Skycreek Ct
- 4124 Tiberon Way
- 4146 Tiberon Way
- 4109 Rio Bravo Dr
- 4127 Tiberon Way
- 4139 Tiberon Way
- 4123 Tiberon Way
- 4151 Tiberon Way
- 4158 Tiberon Way
- 4153 Rio Bravo Dr
- 4101 Rio Grande Dr
- 4100 Rio Grande Dr
- 4163 Tiberon Way
- 14011 Kelsey Dr
- 14001 Kelsey Dr
- 13961 Lindbergh Cir
- 13959 Lindbergh Cir
- 4172 Tiberon Way
- 4089 Rio Bravo Dr
- 6 Tiberon Way
- 3 Tiberon Way