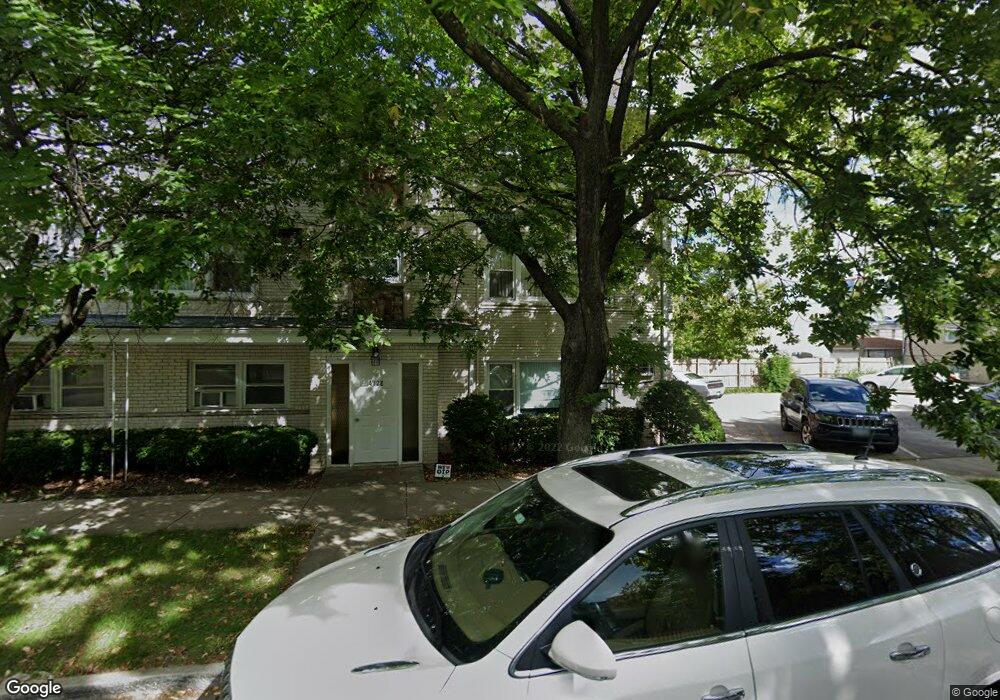
4128 W Byron St Unit 4128202 Chicago, IL 60641
Irving Park NeighborhoodEstimated Value: $172,000 - $213,000
1
Bed
--
Bath
750
Sq Ft
$254/Sq Ft
Est. Value
About This Home
This home is located at 4128 W Byron St Unit 4128202, Chicago, IL 60641 and is currently estimated at $190,208, approximately $253 per square foot. 4128 W Byron St Unit 4128202 is a home located in Cook County with nearby schools including Belding Elementary School, Schurz High School, and St. Viator Elementary School.
Ownership History
Date
Name
Owned For
Owner Type
Purchase Details
Closed on
Aug 3, 2023
Sold by
Derlacki Deborah Jean
Bought by
Derlacki David R and Kurtzke Deborah
Current Estimated Value
Purchase Details
Closed on
Jul 6, 2005
Sold by
Somboon Lert
Bought by
Derlacki Deborah
Purchase Details
Closed on
Apr 20, 2001
Sold by
Ramos David
Bought by
Sombroon Lert
Home Financials for this Owner
Home Financials are based on the most recent Mortgage that was taken out on this home.
Original Mortgage
$83,600
Interest Rate
7.02%
Purchase Details
Closed on
Nov 2, 1994
Sold by
Stanchiu Bonnie J
Bought by
Ramos David
Home Financials for this Owner
Home Financials are based on the most recent Mortgage that was taken out on this home.
Original Mortgage
$58,900
Interest Rate
9%
Create a Home Valuation Report for This Property
The Home Valuation Report is an in-depth analysis detailing your home's value as well as a comparison with similar homes in the area
Home Values in the Area
Average Home Value in this Area
Purchase History
| Date | Buyer | Sale Price | Title Company |
|---|---|---|---|
| Derlacki David R | $113,000 | None Listed On Document | |
| Derlacki Deborah | $151,000 | Multiple | |
| Sombroon Lert | $111,500 | -- | |
| Ramos David | $62,000 | Attorneys Title Guaranty Fun |
Source: Public Records
Mortgage History
| Date | Status | Borrower | Loan Amount |
|---|---|---|---|
| Previous Owner | Sombroon Lert | $83,600 | |
| Previous Owner | Ramos David | $58,900 |
Source: Public Records
Tax History Compared to Growth
Tax History
| Year | Tax Paid | Tax Assessment Tax Assessment Total Assessment is a certain percentage of the fair market value that is determined by local assessors to be the total taxable value of land and additions on the property. | Land | Improvement |
|---|---|---|---|---|
| 2024 | $3,178 | $12,952 | $3,792 | $9,160 |
| 2023 | $3,098 | $15,000 | $3,072 | $11,928 |
| 2022 | $3,098 | $15,000 | $3,072 | $11,928 |
| 2021 | $3,028 | $14,999 | $3,072 | $11,927 |
| 2020 | $2,834 | $12,672 | $1,536 | $11,136 |
| 2019 | $2,820 | $13,983 | $1,536 | $12,447 |
| 2018 | $2,773 | $13,983 | $1,536 | $12,447 |
| 2017 | $2,871 | $13,284 | $1,344 | $11,940 |
| 2016 | $2,671 | $13,284 | $1,344 | $11,940 |
| 2015 | $2,444 | $13,284 | $1,344 | $11,940 |
| 2014 | $1,531 | $12,620 | $1,152 | $11,468 |
| 2013 | $2,305 | $12,620 | $1,152 | $11,468 |
Source: Public Records
Map
Nearby Homes
- 4028 W Waveland Ave
- 3829 N Kildare Ave
- 3811 N Kildare Ave
- 3856 N Kildare Ave
- 4110 N Keystone Ave Unit 1N
- 3728 N Kildare Ave
- 4126 N Kedvale Ave Unit 302
- 4146 N Kedvale Ave Unit 1C
- 3826 N Hamlin Ave
- 4347 W Irving Park Rd
- 3701 N Lowell Ave
- 3608 N Tripp Ave
- 4160 W Eddy St
- 4012 W Eddy St
- 3506 N Keeler Ave
- 4170 W Cornelia Ave
- 3904 W Eddy St
- 4239 N Keystone Ave Unit 3S
- 4243 N Keystone Ave Unit GN
- 3643 N Hamlin Ave
- 4128 W Byron St Unit 4128101
- 4128 W Byron St Unit 4128302
- 4128 W Byron St Unit 4128201
- 4128 W Byron St Unit 4128301
- 4128 W Byron St Unit 101
- 4128 W Byron St Unit 301
- 4130 W Byron St Unit 4130104
- 4130 W Byron St Unit 4130203
- 4130 W Byron St Unit 4130303
- 4130 W Byron St Unit 203
- 3909 N Kedvale Ave
- 3913 N Kedvale Ave Unit C
- 3913 N Kedvale Ave Unit B
- 3857 N Kedvale Ave
- 4114 W Byron St
- 4114 W Byron St Unit 1
- 4114 W Byron St Unit 2
- 4114 W Byron St Unit BASEMENT
- 3916 W 5th Ave Unit 2E
- 3916 W 5th Ave Unit 3E