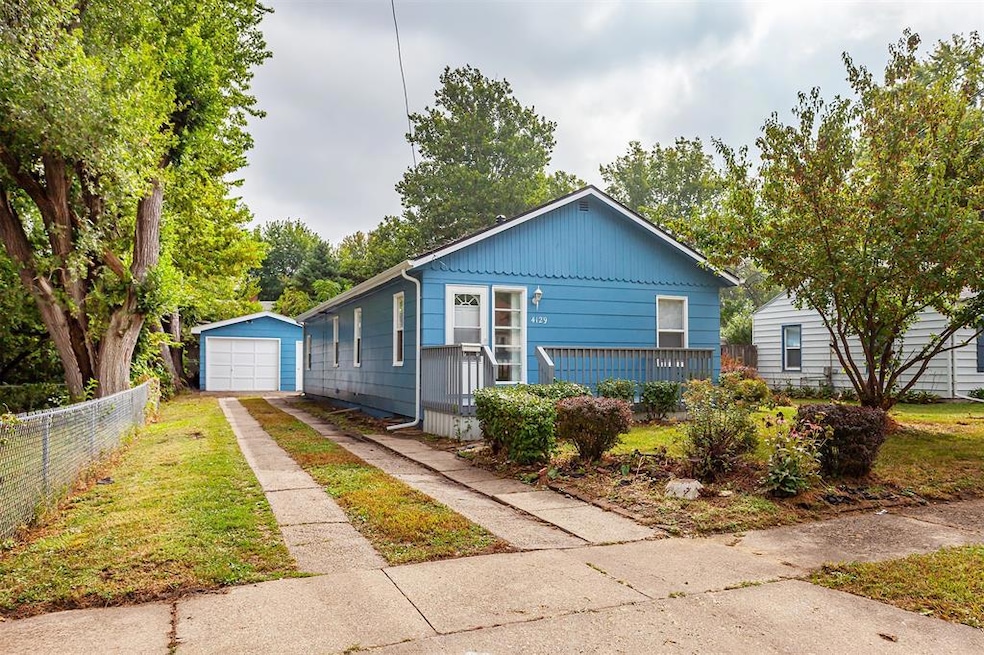
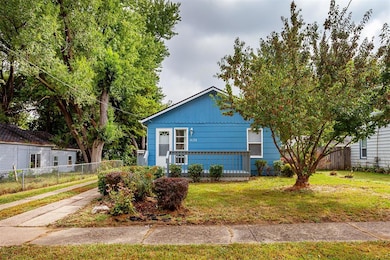
4129 5th Ave Des Moines, IA 50313
Highland Park NeighborhoodEstimated payment $1,174/month
Highlights
- Ranch Style House
- Forced Air Heating and Cooling System
- Dining Area
- No HOA
- Family Room
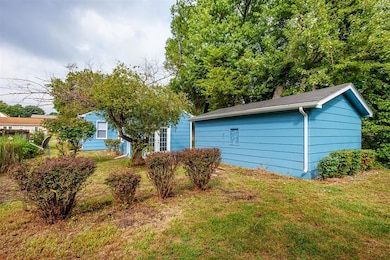
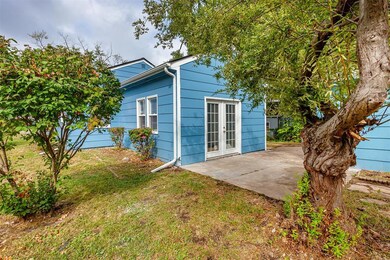
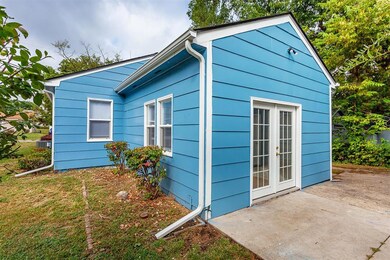
About This Home
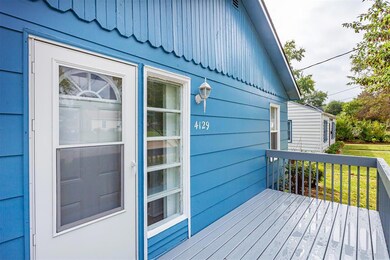
Beautifully updated home at 4129 5th Avenue, Des Moines, IA 50313-3424. This charming residence features a brand new roof, new windows, and a modernized kitchen and bathroom. The newer HVAC system ensures comfort year-round. All appliances are new, making move-in easy. The bonus room offers versatile space that can function as a third bedroom or a home office. Don't miss the opportunity to own this turnkey property! All information obtained from seller and public records.
Home Details
Home Type
- Single Family
Est. Annual Taxes
- $2,920
Year Built
- Built in 1920
Lot Details
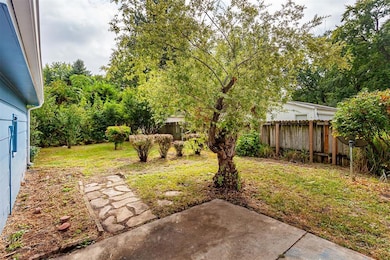
- 6,900 Sq Ft Lot
- Property is zoned N3B
Parking
- Driveway
Home Design
- Ranch Style House
- Block Foundation
- Asphalt Shingled Roof
- Cement Board or Planked
Interior Spaces
- 1,032 Sq Ft Home
- Family Room
- Dining Area
- Finished Basement
Kitchen
- Stove
- Microwave
Bedrooms and Bathrooms
- 2 Main Level Bedrooms
- 1 Full Bathroom
Utilities
- Forced Air Heating and Cooling System
Community Details
- No Home Owners Association
Listing and Financial Details
- Assessor Parcel Number 07000944000000
Map
Home Values in the Area
Average Home Value in this Area
Tax History
| Year | Tax Paid | Tax Assessment Tax Assessment Total Assessment is a certain percentage of the fair market value that is determined by local assessors to be the total taxable value of land and additions on the property. | Land | Improvement |
|---|---|---|---|---|
| 2025 | $2,646 | $155,200 | $31,300 | $123,900 |
| 2024 | $2,646 | $134,500 | $27,100 | $107,400 |
| 2023 | $2,648 | $134,500 | $27,100 | $107,400 |
| 2022 | $2,628 | $112,400 | $23,600 | $88,800 |
| 2021 | $2,468 | $112,400 | $23,600 | $88,800 |
| 2020 | $2,564 | $98,900 | $20,600 | $78,300 |
| 2019 | $2,364 | $98,900 | $20,600 | $78,300 |
| 2018 | $2,342 | $88,000 | $17,800 | $70,200 |
| 2017 | $2,172 | $88,000 | $17,800 | $70,200 |
| 2016 | $2,116 | $80,300 | $16,100 | $64,200 |
| 2015 | $2,116 | $80,300 | $16,100 | $64,200 |
| 2014 | $2,146 | $80,800 | $15,700 | $65,100 |
Property History
| Date | Event | Price | List to Sale | Price per Sq Ft |
|---|---|---|---|---|
| 12/05/2025 12/05/25 | For Sale | $177,500 | 0.0% | $172 / Sq Ft |
| 10/15/2025 10/15/25 | Pending | -- | -- | -- |
| 10/08/2025 10/08/25 | Price Changed | $177,500 | -1.3% | $172 / Sq Ft |
| 09/22/2025 09/22/25 | For Sale | $179,900 | -- | $174 / Sq Ft |
Purchase History
| Date | Type | Sale Price | Title Company |
|---|---|---|---|
| Quit Claim Deed | -- | None Listed On Document | |
| Quit Claim Deed | -- | None Listed On Document | |
| Warranty Deed | $105,000 | None Listed On Document | |
| Warranty Deed | $105,000 | None Listed On Document | |
| Quit Claim Deed | -- | -- | |
| Special Warranty Deed | -- | -- | |
| Sheriffs Deed | $43,319 | -- | |
| Corporate Deed | -- | -- |
Mortgage History
| Date | Status | Loan Amount | Loan Type |
|---|---|---|---|
| Previous Owner | $57,171 | Purchase Money Mortgage |
Source: Des Moines Area Association of REALTORS®
MLS Number: 726714
APN: 070-00944000000
Disclaimer: Certain information contained herein is derived from information provided by parties other than Homes.com. All information provided is deemed reliable, but is not guaranteed to be accurate and should be independently verified.
![]() IDX information is provided exclusively for personal, non-commercial use, and may not be used for any purpose other than to identify prospective properties consumers may be interested in purchasing. Information is deemed reliable but not guaranteed.
IDX information is provided exclusively for personal, non-commercial use, and may not be used for any purpose other than to identify prospective properties consumers may be interested in purchasing. Information is deemed reliable but not guaranteed.
- 3830 6th Ave
- 4202 NE 3rd St
- 3916 9th St
- 1131 Euclid Ave Unit 2
- 2826 Oxford St
- 1216-1306 E Seneca Ave
- 3215 E 8th St
- 3315 E 15th St
- 2531 Lynner Dr
- 2537 Lynner Dr
- 1332 E Sheridan Ave
- 2411 Welbeck Rd
- 1926 7th St
- 2418 Boston Ave
- 1276 NE 52nd Ave
- 1809 Arlington Ave Unit 2
- 1809 Arlington Ave Unit 10
- 1805 Arlington Ave Unit 7
- 2829 Douglas Ave
- 2614 Adams Ave
