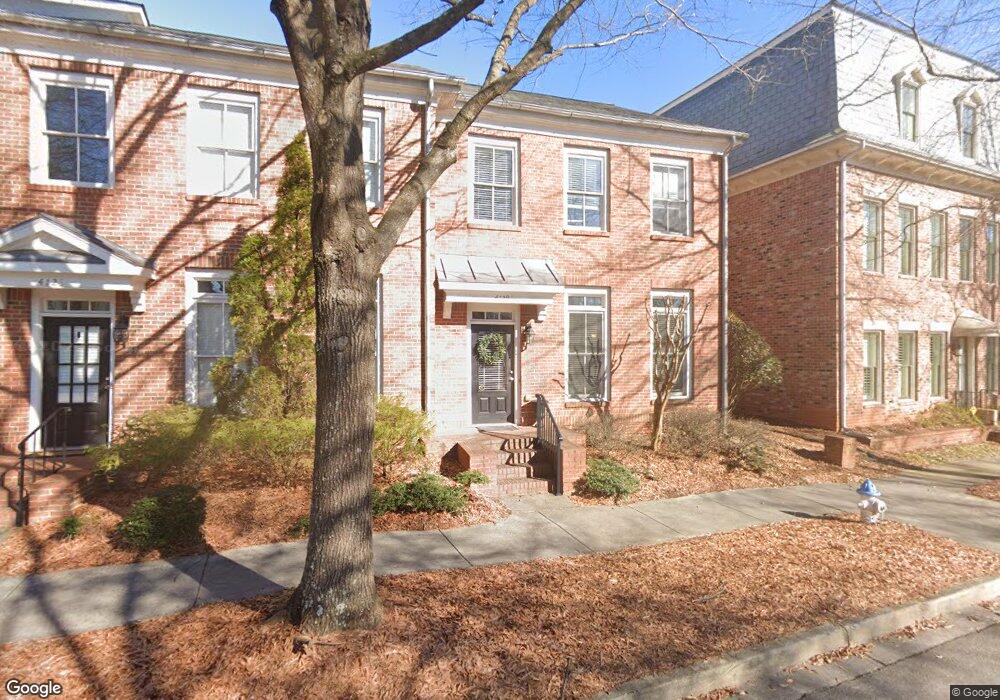
4129 Hunt St SW Covington, GA 30014
Estimated Value: $265,260 - $386,000
2
Beds
3
Baths
1,728
Sq Ft
$187/Sq Ft
Est. Value
About This Home
This home is located at 4129 Hunt St SW, Covington, GA 30014 and is currently estimated at $323,815, approximately $187 per square foot. 4129 Hunt St SW is a home located in Newton County with nearby schools including Porterdale Elementary School, Clements Middle School, and Eastside High School.
Ownership History
Date
Name
Owned For
Owner Type
Purchase Details
Closed on
May 15, 2020
Sold by
Parke Charles
Bought by
Pharr Kellie
Current Estimated Value
Home Financials for this Owner
Home Financials are based on the most recent Mortgage that was taken out on this home.
Original Mortgage
$181,000
Outstanding Balance
$160,391
Interest Rate
3.3%
Mortgage Type
New Conventional
Estimated Equity
$163,424
Purchase Details
Closed on
Dec 12, 2016
Sold by
Pullen Stephen L
Bought by
Parke Charles and Parke Donna
Home Financials for this Owner
Home Financials are based on the most recent Mortgage that was taken out on this home.
Original Mortgage
$98,000
Interest Rate
3.57%
Mortgage Type
New Conventional
Purchase Details
Closed on
Mar 1, 2013
Sold by
Morgan Donald E
Bought by
Pullen Stephen Leroy
Home Financials for this Owner
Home Financials are based on the most recent Mortgage that was taken out on this home.
Original Mortgage
$153,225
Interest Rate
3.56%
Mortgage Type
VA
Create a Home Valuation Report for This Property
The Home Valuation Report is an in-depth analysis detailing your home's value as well as a comparison with similar homes in the area
Home Values in the Area
Average Home Value in this Area
Purchase History
| Date | Buyer | Sale Price | Title Company |
|---|---|---|---|
| Pharr Kellie | $191,000 | -- | |
| Parke Charles | $167,000 | -- | |
| Pullen Stephen Leroy | $150,000 | -- |
Source: Public Records
Mortgage History
| Date | Status | Borrower | Loan Amount |
|---|---|---|---|
| Open | Pharr Kellie | $181,000 | |
| Previous Owner | Parke Charles | $98,000 | |
| Previous Owner | Pullen Stephen Leroy | $153,225 |
Source: Public Records
Tax History Compared to Growth
Tax History
| Year | Tax Paid | Tax Assessment Tax Assessment Total Assessment is a certain percentage of the fair market value that is determined by local assessors to be the total taxable value of land and additions on the property. | Land | Improvement |
|---|---|---|---|---|
| 2024 | $2,861 | $99,880 | $14,000 | $85,880 |
| 2023 | $3,338 | $107,880 | $14,000 | $93,880 |
| 2022 | $2,925 | $93,240 | $14,000 | $79,240 |
| 2021 | $2,657 | $81,560 | $14,000 | $67,560 |
| 2020 | $3,083 | $77,280 | $14,000 | $63,280 |
| 2019 | $2,779 | $68,400 | $14,000 | $54,400 |
| 2018 | $2,724 | $66,280 | $14,000 | $52,280 |
| 2017 | $2,745 | $67,440 | $14,000 | $53,440 |
| 2016 | $2,472 | $60,160 | $15,200 | $44,960 |
| 2015 | $2,539 | $61,720 | $15,200 | $46,520 |
| 2014 | $2,468 | $61,720 | $0 | $0 |
Source: Public Records
Map
Nearby Homes
- 5102 Park St SW
- 5125 Swann St SW
- 5168 Pratt St SW
- 5135 Arnold St
- 4105 Washington St SW
- 3107 Hendrix Cir SW
- 0 S Highway 81 Unit 10621341
- 163 Kingfisher Walk
- 2220 Lee St SW
- 2222 Lee St SW
- 3132 Lunsford Cir SW
- 13709 Whitman Ln
- 13806 Homer Ln
- 0 Old Covered Bridge Rd Unit 10618938
- 7205 Lakeview Dr SW
- 12109 Brown Bridge Rd
- 12103 Brown Bridge Rd
- 4689 Sunrise Ridge
- 4125 Hunt St SW
- 4125 Hunt St SW Unit 4125
- 4139 Hunt St SW Unit 3A
- 4139 Hunt St SW
- 4135 Hunt St SW
- 4135 Hunt St SW
- 4135 Hunt St SW Unit 3A
- 4121 Hunt St SW
- 4131 Hunt St SW
- 4117 Hunt St SW Unit 1D
- 4133 Hunt St SW
- 4133 Hunt St SW Unit 2A
- 4137 Hunt St SW Unit 2B
- 4137 Hunt St Unit 2 B
- 4137 Hunt St
- 4141 Hunt St SW
- 4115 Hunt St SW Unit 1
- 0 Hunt St Unit 3149424
- 0 Hunt St Unit 8700918
- 0 Hunt St Unit 8695151