Estimated Value: $290,000 - $318,000
3
Beds
2
Baths
1,584
Sq Ft
$188/Sq Ft
Est. Value
About This Home
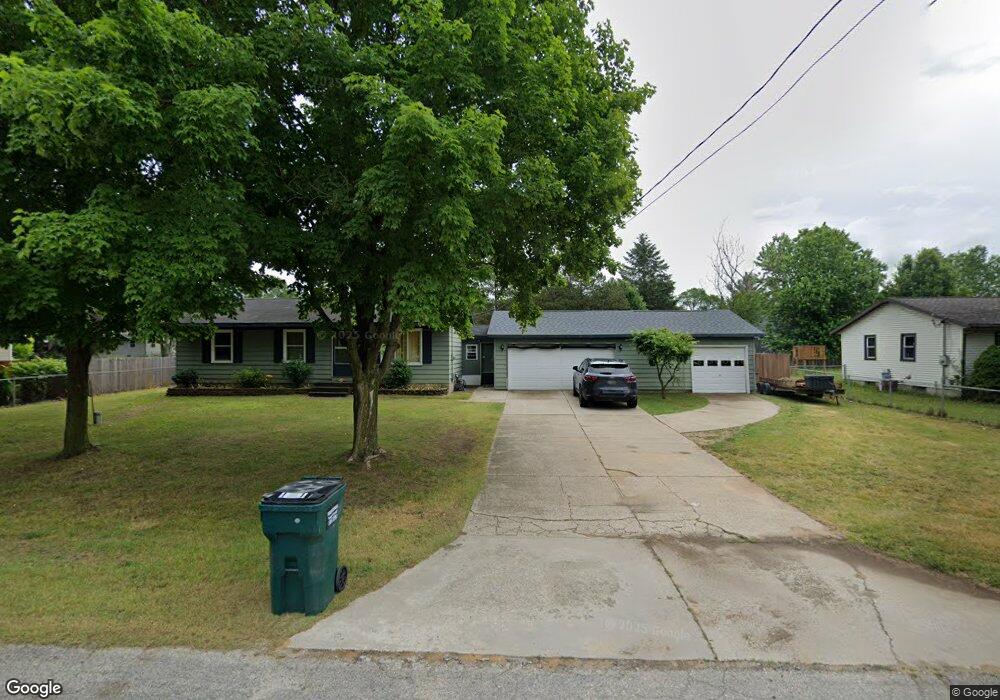
This home is located at 4129 Sandy Dr, Dorr, MI 49323 and is currently estimated at $298,517, approximately $188 per square foot. 4129 Sandy Dr is a home located in Allegan County with nearby schools including Wayland High School, Moline Christian School, and St. Stanislaus School.
Ownership History
Date
Name
Owned For
Owner Type
Purchase Details
Closed on
Feb 13, 2019
Sold by
Carpenter Shannon and Cole Shannon
Bought by
Carpenter Lynn D and Carpenter Shannon M
Current Estimated Value
Home Financials for this Owner
Home Financials are based on the most recent Mortgage that was taken out on this home.
Original Mortgage
$138,380
Outstanding Balance
$123,439
Interest Rate
5.25%
Mortgage Type
FHA
Estimated Equity
$175,078
Purchase Details
Closed on
Apr 11, 2008
Sold by
Freiberg Greg S and Freiberg Michele J
Bought by
Cole Shannon
Home Financials for this Owner
Home Financials are based on the most recent Mortgage that was taken out on this home.
Original Mortgage
$123,920
Interest Rate
6.09%
Mortgage Type
FHA
Purchase Details
Closed on
May 21, 1996
Sold by
Wyatt Shawn and Wyatt Sonia
Bought by
Freiberg Greg S
Create a Home Valuation Report for This Property
The Home Valuation Report is an in-depth analysis detailing your home's value as well as a comparison with similar homes in the area
Home Values in the Area
Average Home Value in this Area
Purchase History
| Date | Buyer | Sale Price | Title Company |
|---|---|---|---|
| Carpenter Lynn D | -- | None Available | |
| Cole Shannon | $124,900 | Group Title Services | |
| Freiberg Greg S | $87,000 | -- |
Source: Public Records
Mortgage History
| Date | Status | Borrower | Loan Amount |
|---|---|---|---|
| Open | Carpenter Lynn D | $138,380 | |
| Closed | Cole Shannon | $123,920 |
Source: Public Records
Tax History Compared to Growth
Tax History
| Year | Tax Paid | Tax Assessment Tax Assessment Total Assessment is a certain percentage of the fair market value that is determined by local assessors to be the total taxable value of land and additions on the property. | Land | Improvement |
|---|---|---|---|---|
| 2025 | $2,202 | $114,400 | $43,800 | $70,600 |
| 2024 | $1,998 | $103,800 | $38,300 | $65,500 |
| 2023 | $2,046 | $92,300 | $35,400 | $56,900 |
| 2022 | $1,998 | $83,100 | $31,700 | $51,400 |
| 2021 | $1,875 | $77,900 | $30,500 | $47,400 |
| 2020 | $1,794 | $75,500 | $29,000 | $46,500 |
| 2019 | $1,794 | $67,800 | $26,400 | $41,400 |
| 2018 | $1,755 | $62,500 | $17,000 | $45,500 |
| 2017 | $0 | $65,000 | $17,000 | $48,000 |
| 2016 | $0 | $58,000 | $17,000 | $41,000 |
| 2015 | -- | $58,000 | $17,000 | $41,000 |
| 2014 | -- | $53,400 | $15,000 | $38,400 |
| 2013 | -- | $52,000 | $15,000 | $37,000 |
Source: Public Records
Map
Nearby Homes
- 1341 142nd Ave
- 1659 Creek Side Ct
- 4087 Ronalds Rd
- 4159 White Pine Dr
- 4101 White Pine Dr Unit 4
- 4312 Woodside Meadow Ct
- 1722 144th Ave
- 2081 142nd Ave
- Lot 11 Walnut Dale Dr
- 4351 Hickory View Ct
- 4335 Tavistock Dr
- 4316 Sussex Place
- 3778 22nd St
- 4273 Highpoint Dr Unit 112
- Unit 111 Highpoint Dr
- 3897 Division St
- 2298 138th Ave
- 4240 Butternut Dr
- Vienna Plan at Harvest Meadows
- Charlotte Plan at Harvest Meadows