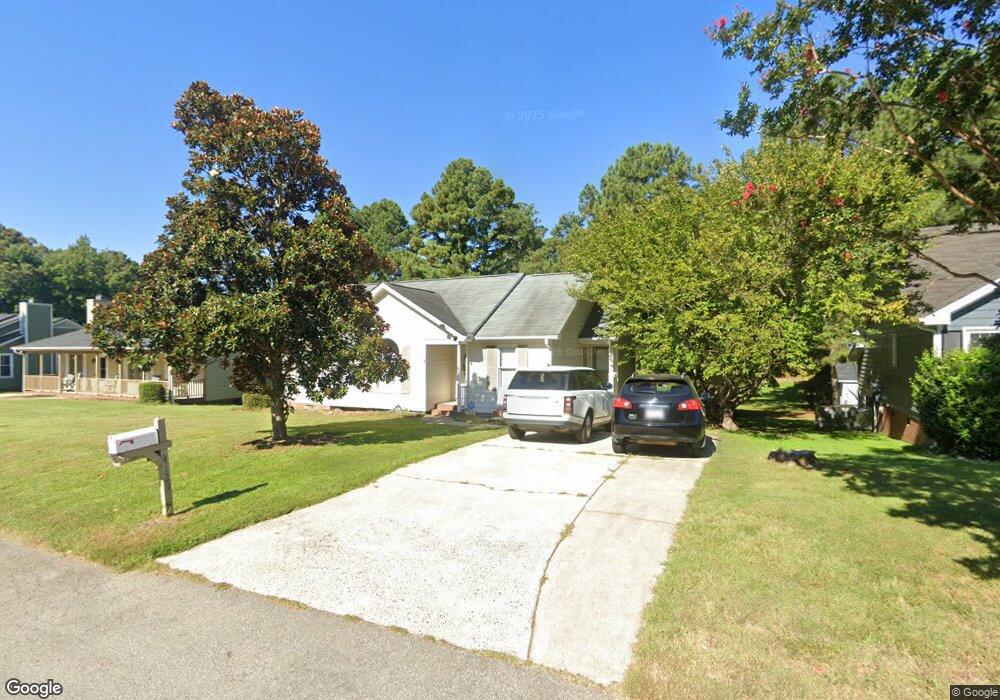
4129 Willow Haven Ct Raleigh, NC 27616
Forestville NeighborhoodEstimated Value: $309,000 - $319,882
3
Beds
2
Baths
1,321
Sq Ft
$239/Sq Ft
Est. Value
About This Home
This home is located at 4129 Willow Haven Ct, Raleigh, NC 27616 and is currently estimated at $315,471, approximately $238 per square foot. 4129 Willow Haven Ct is a home located in Wake County with nearby schools including Harris Creek Elementary School, Rolesville Middle School, and Rolesville High School.
Ownership History
Date
Name
Owned For
Owner Type
Purchase Details
Closed on
Jan 27, 2022
Sold by
Noreen Thornton Donna
Bought by
Thornton Donna Noreen and Thornton Larhonda Y
Current Estimated Value
Purchase Details
Closed on
Apr 29, 2020
Sold by
Thornton Donna Noreen
Bought by
Thornton Donna Noreen and Thornton Larhonda
Purchase Details
Closed on
Nov 25, 2019
Sold by
Opendoor Property C Llc
Bought by
Thornton Donna Noreen
Home Financials for this Owner
Home Financials are based on the most recent Mortgage that was taken out on this home.
Original Mortgage
$187,937
Interest Rate
3.5%
Mortgage Type
New Conventional
Purchase Details
Closed on
Aug 13, 2019
Sold by
Licht Anthony J and Licht Katie
Bought by
Opendoor Property C Llc
Purchase Details
Closed on
Jul 24, 1998
Sold by
Murphy Johnny
Bought by
Hurm Elyse H
Home Financials for this Owner
Home Financials are based on the most recent Mortgage that was taken out on this home.
Original Mortgage
$100,400
Interest Rate
7.02%
Create a Home Valuation Report for This Property
The Home Valuation Report is an in-depth analysis detailing your home's value as well as a comparison with similar homes in the area
Home Values in the Area
Average Home Value in this Area
Purchase History
| Date | Buyer | Sale Price | Title Company |
|---|---|---|---|
| Thornton Donna Noreen | -- | City Of Oaks Law | |
| Thornton Donna Noreen | -- | None Available | |
| Thornton Donna Noreen | $194,000 | Chicago Title | |
| Opendoor Property C Llc | $189,000 | None Available | |
| Hurm Elyse H | $103,500 | -- |
Source: Public Records
Mortgage History
| Date | Status | Borrower | Loan Amount |
|---|---|---|---|
| Previous Owner | Thornton Donna Noreen | $187,937 | |
| Previous Owner | Hurm Elyse H | $100,400 |
Source: Public Records
Tax History Compared to Growth
Tax History
| Year | Tax Paid | Tax Assessment Tax Assessment Total Assessment is a certain percentage of the fair market value that is determined by local assessors to be the total taxable value of land and additions on the property. | Land | Improvement |
|---|---|---|---|---|
| 2025 | $1,973 | $305,411 | $125,000 | $180,411 |
| 2024 | $1,917 | $305,411 | $125,000 | $180,411 |
| 2023 | $1,392 | $175,989 | $40,000 | $135,989 |
| 2022 | $1,291 | $175,989 | $40,000 | $135,989 |
| 2021 | $1,257 | $175,989 | $40,000 | $135,989 |
| 2020 | $1,236 | $175,989 | $40,000 | $135,989 |
| 2019 | $1,038 | $124,685 | $28,000 | $96,685 |
| 2018 | $956 | $124,685 | $28,000 | $96,685 |
| 2017 | $907 | $124,685 | $28,000 | $96,685 |
| 2016 | $888 | $124,685 | $28,000 | $96,685 |
| 2015 | $899 | $126,532 | $32,000 | $94,532 |
| 2014 | $853 | $126,532 | $32,000 | $94,532 |
Source: Public Records
Map
Nearby Homes
- 4140 Willow Haven Ct
- 4112 Timberbrook Dr
- 3814 Tyler Bluff Ln
- 3209 Leebrook Rd
- 3321 Beech Bluff Ln
- Taylorsville Plan at Watkins Glen
- Johnson Plan at Watkins Glen
- Sherwood Plan at Watkins Glen
- Chatham Plan at Watkins Glen
- 4416 Willow Lake Rd
- 4028 Wesley Chapel Way
- 4226 Gray Alder Ln
- 3617 Jordan Mill Ct
- 3626 Jordan Mill Ct
- 3500 Telluride Trail
- 3504 Telluride Trail
- 3512 Telluride Trail
- 3508 Telluride Trail
- 4018 Rothfield Ln
- 3516 Telluride Trail
- 4133 Willow Haven Ct
- 4125 Willow Haven Ct
- 4128 Willow Haven Ct
- 4121 Willow Haven Ct
- 4137 Willow Haven Ct
- 4124 Willow Haven Ct
- 4132 Willow Haven Ct
- 4120 Willow Haven Ct
- 4117 Willow Haven Ct
- 4141 Willow Haven Ct
- 4116 Willow Haven Ct
- 4144 Willow Haven Ct
- 3404 Belin Ct
- 4113 Willow Haven Ct
- 4145 Willow Haven Ct
- 4148 Willow Haven Ct
- 4109 Willow Haven Ct
- 3400 Belin Ct
- 3409 Belin Ct
- 4149 Willow Haven Ct