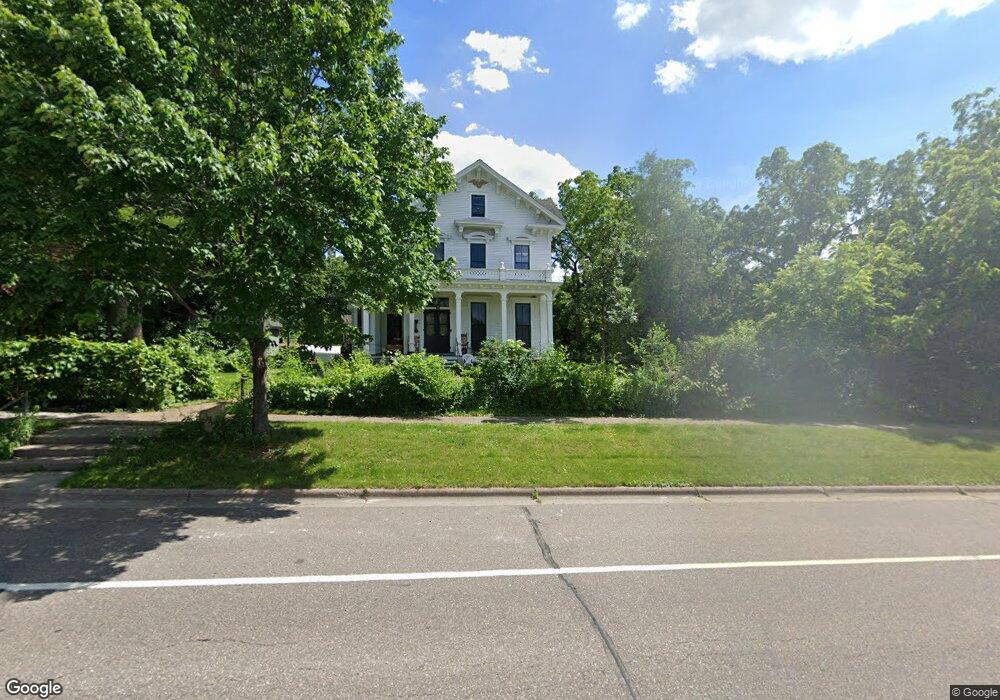
413 2nd St W Hastings, MN 55033
Hastings-Marshan Township NeighborhoodEstimated Value: $383,000 - $488,000
5
Beds
2
Baths
4,013
Sq Ft
$105/Sq Ft
Est. Value
About This Home
This home is located at 413 2nd St W, Hastings, MN 55033 and is currently estimated at $422,995, approximately $105 per square foot. 413 2nd St W is a home located in Dakota County with nearby schools including Hastings Middle School, Christa Mcauliffe Elementary School, and Hastings High School.
Ownership History
Date
Name
Owned For
Owner Type
Purchase Details
Closed on
Feb 20, 2013
Sold by
Federal Home Loan Mortgage Corporation
Bought by
Weiland Fred Earl
Current Estimated Value
Home Financials for this Owner
Home Financials are based on the most recent Mortgage that was taken out on this home.
Original Mortgage
$122,430
Outstanding Balance
$85,308
Interest Rate
3.34%
Mortgage Type
Future Advance Clause Open End Mortgage
Estimated Equity
$337,687
Purchase Details
Closed on
Dec 30, 2011
Sold by
Melson Robert W and Breitschwerdt Vicki L
Bought by
Citimortgage Inc
Create a Home Valuation Report for This Property
The Home Valuation Report is an in-depth analysis detailing your home's value as well as a comparison with similar homes in the area
Home Values in the Area
Average Home Value in this Area
Purchase History
| Date | Buyer | Sale Price | Title Company |
|---|---|---|---|
| Weiland Fred Earl | -- | Title One Inc | |
| Citimortgage Inc | $162,042 | None Available |
Source: Public Records
Mortgage History
| Date | Status | Borrower | Loan Amount |
|---|---|---|---|
| Open | Weiland Fred Earl | $122,430 |
Source: Public Records
Tax History Compared to Growth
Tax History
| Year | Tax Paid | Tax Assessment Tax Assessment Total Assessment is a certain percentage of the fair market value that is determined by local assessors to be the total taxable value of land and additions on the property. | Land | Improvement |
|---|---|---|---|---|
| 2024 | $3,736 | $327,300 | $123,800 | $203,500 |
| 2023 | $3,736 | $323,400 | $123,900 | $199,500 |
| 2022 | $3,306 | $313,300 | $123,700 | $189,600 |
| 2021 | $3,108 | $278,500 | $107,600 | $170,900 |
| 2020 | $3,240 | $261,800 | $102,500 | $159,300 |
| 2019 | $3,394 | $263,400 | $99,500 | $163,900 |
| 2018 | $3,238 | $262,000 | $94,700 | $167,300 |
| 2017 | $2,925 | $243,600 | $90,200 | $153,400 |
| 2016 | $2,816 | $222,100 | $84,200 | $137,900 |
| 2015 | $2,700 | $191,660 | $74,656 | $117,004 |
| 2014 | -- | $184,684 | $71,479 | $113,205 |
| 2013 | -- | $172,694 | $63,931 | $108,763 |
Source: Public Records
Map
Nearby Homes