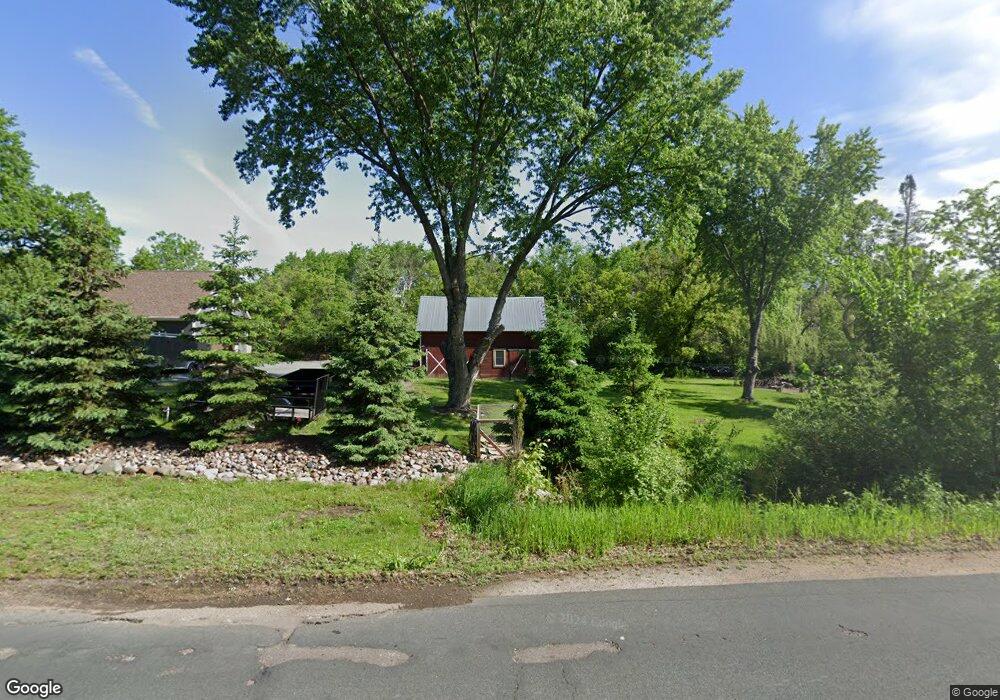
413 3rd Ave E Osceola, WI 54020
Estimated Value: $373,000 - $444,000
8
Beds
3
Baths
3,200
Sq Ft
$126/Sq Ft
Est. Value
About This Home
This home is located at 413 3rd Ave E, Osceola, WI 54020 and is currently estimated at $403,143, approximately $125 per square foot. 413 3rd Ave E is a home located in Polk County with nearby schools including Osceola Elementary School, Osceola Intermediate School, and Osceola Middle School.
Ownership History
Date
Name
Owned For
Owner Type
Purchase Details
Closed on
Aug 30, 2021
Sold by
Broder Properties Llc
Bought by
Erickson Mark G and Erickson Lisa M
Current Estimated Value
Home Financials for this Owner
Home Financials are based on the most recent Mortgage that was taken out on this home.
Original Mortgage
$236,250
Outstanding Balance
$212,613
Interest Rate
2.8%
Mortgage Type
New Conventional
Estimated Equity
$190,530
Purchase Details
Closed on
Oct 7, 2015
Sold by
Carlsted Douglas J and Carlsted Bruce F
Bought by
Border Properties Llc
Create a Home Valuation Report for This Property
The Home Valuation Report is an in-depth analysis detailing your home's value as well as a comparison with similar homes in the area
Home Values in the Area
Average Home Value in this Area
Purchase History
| Date | Buyer | Sale Price | Title Company |
|---|---|---|---|
| Erickson Mark G | $315,000 | Polk County Abstract & Title | |
| Border Properties Llc | -- | None Available |
Source: Public Records
Mortgage History
| Date | Status | Borrower | Loan Amount |
|---|---|---|---|
| Open | Erickson Mark G | $236,250 |
Source: Public Records
Tax History
| Year | Tax Paid | Tax Assessment Tax Assessment Total Assessment is a certain percentage of the fair market value that is determined by local assessors to be the total taxable value of land and additions on the property. | Land | Improvement |
|---|---|---|---|---|
| 2025 | $5,141 | $335,800 | $34,300 | $301,500 |
| 2024 | $4,680 | $335,800 | $34,300 | $301,500 |
| 2023 | $4,773 | $335,800 | $34,300 | $301,500 |
| 2022 | $5,167 | $335,800 | $34,300 | $301,500 |
| 2021 | $4,447 | $180,100 | $27,500 | $152,600 |
| 2020 | $4,459 | $180,100 | $27,500 | $152,600 |
| 2019 | $4,374 | $180,100 | $27,500 | $152,600 |
| 2018 | $4,056 | $180,100 | $27,500 | $152,600 |
| 2017 | $3,612 | $180,100 | $27,500 | $152,600 |
| 2016 | $3,754 | $180,100 | $27,500 | $152,600 |
| 2015 | $3,022 | $166,500 | $33,100 | $133,400 |
| 2013 | $3,134 | $166,500 | $33,100 | $133,400 |
| 2012 | $3,149 | $166,500 | $33,100 | $133,400 |
Source: Public Records
Map
Nearby Homes
Your Personal Tour Guide
Ask me questions while you tour the home.