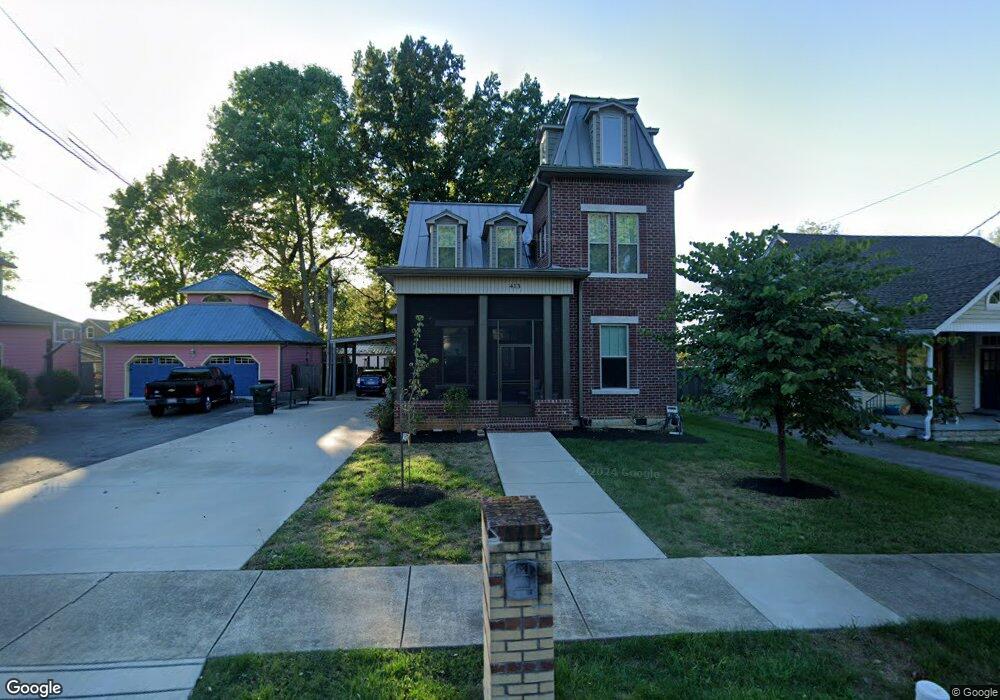
413 Boren St Unit A Springfield, TN 37172
Estimated Value: $347,000 - $462,000
Studio
1
Bath
2,133
Sq Ft
$193/Sq Ft
Est. Value
About This Home
This home is located at 413 Boren St Unit A, Springfield, TN 37172 and is currently estimated at $412,117, approximately $193 per square foot. 413 Boren St Unit A is a home located in Robertson County with nearby schools including Cheatham Park Elementary School, Westside Elementary School, and Innovation Academy.
Ownership History
Date
Name
Owned For
Owner Type
Purchase Details
Closed on
May 31, 2019
Sold by
Jones Terry and Jones Lisa
Bought by
Eckerman Kevin and Eckerman Martha
Current Estimated Value
Purchase Details
Closed on
Apr 17, 2017
Sold by
Alford James F and Alford Joan L
Bought by
Jones Terry and Jones Lisa
Purchase Details
Closed on
Aug 21, 2009
Sold by
C
Bought by
Alford James E
Purchase Details
Closed on
Feb 10, 1995
Bought by
C & S Investments
Purchase Details
Closed on
May 19, 1983
Bought by
Head Karen Fay
Create a Home Valuation Report for This Property
The Home Valuation Report is an in-depth analysis detailing your home's value as well as a comparison with similar homes in the area
Home Values in the Area
Average Home Value in this Area
Purchase History
| Date | Buyer | Sale Price | Title Company |
|---|---|---|---|
| Eckerman Kevin | -- | None Available | |
| Jones Terry | $500,000 | None Available | |
| Alford James E | $51,000 | -- | |
| C & S Investments | $29,000 | -- | |
| Head Karen Fay | -- | -- |
Source: Public Records
Tax History
| Year | Tax Paid | Tax Assessment Tax Assessment Total Assessment is a certain percentage of the fair market value that is determined by local assessors to be the total taxable value of land and additions on the property. | Land | Improvement |
|---|---|---|---|---|
| 2025 | -- | $111,175 | $13,750 | $97,425 |
| 2024 | -- | $111,175 | $13,750 | $97,425 |
| 2023 | $2,785 | $111,175 | $13,750 | $97,425 |
| 2022 | $2,603 | $71,350 | $3,750 | $67,600 |
| 2021 | $2,603 | $71,350 | $3,750 | $67,600 |
| 2020 | $137 | $3,750 | $3,750 | $0 |
| 2019 | $14,234 | $12,950 | $3,750 | $9,200 |
| 2018 | $473 | $12,950 | $3,750 | $9,200 |
| 2017 | $510 | $11,900 | $3,075 | $8,825 |
| 2016 | $510 | $11,900 | $3,075 | $8,825 |
| 2015 | $495 | $11,900 | $3,075 | $8,825 |
| 2014 | $495 | $11,900 | $3,075 | $8,825 |
Source: Public Records
Map
Nearby Homes
Your Personal Tour Guide
Ask me questions while you tour the home.