Estimated Value: $439,052 - $470,000
3
Beds
2
Baths
2,208
Sq Ft
$207/Sq Ft
Est. Value
About This Home
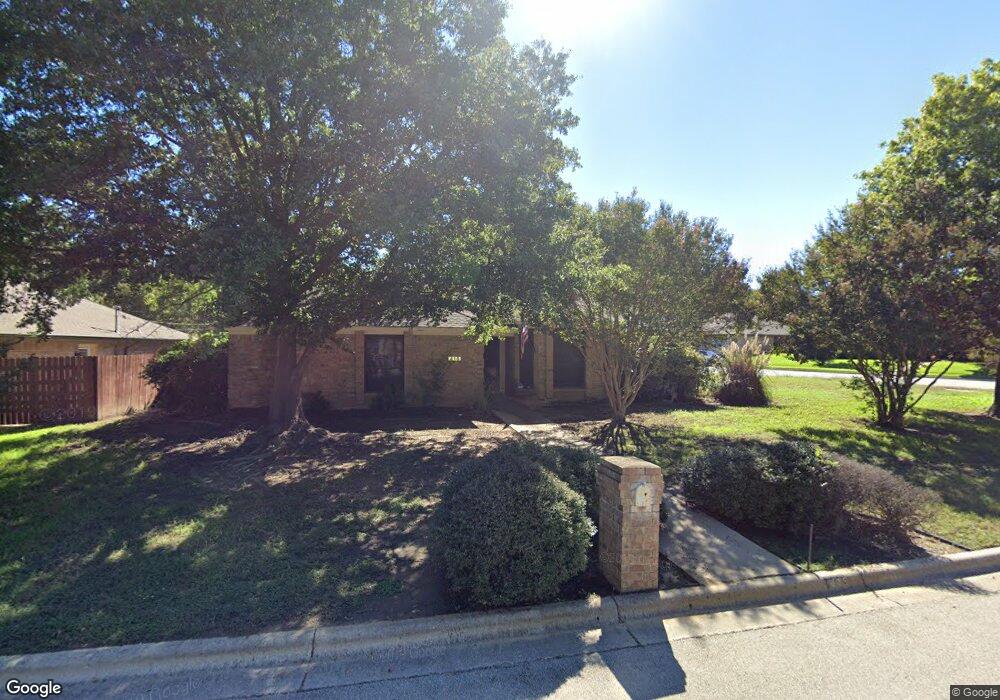
This home is located at 413 Bremen Dr, Hurst, TX 76054 and is currently estimated at $456,263, approximately $206 per square foot. 413 Bremen Dr is a home located in Tarrant County with nearby schools including W.A. Porter Elementary School, Smithfield Middle School, and Birdville High School.
Ownership History
Date
Name
Owned For
Owner Type
Purchase Details
Closed on
May 3, 2012
Sold by
Daulton Jacqueline R
Bought by
Daulton Kent D
Current Estimated Value
Purchase Details
Closed on
Jun 26, 2000
Sold by
Wells Dorsa Gale and Wells Shelley K
Bought by
Daulton Kent D and Daulton Jacqueline R
Home Financials for this Owner
Home Financials are based on the most recent Mortgage that was taken out on this home.
Original Mortgage
$117,600
Outstanding Balance
$43,361
Interest Rate
8.66%
Estimated Equity
$412,902
Purchase Details
Closed on
Mar 23, 1995
Sold by
Martin William Ray and Martin Lois J
Bought by
Wells Dorsa Gale and Wells Shelley K
Home Financials for this Owner
Home Financials are based on the most recent Mortgage that was taken out on this home.
Original Mortgage
$76,000
Interest Rate
6.25%
Create a Home Valuation Report for This Property
The Home Valuation Report is an in-depth analysis detailing your home's value as well as a comparison with similar homes in the area
Home Values in the Area
Average Home Value in this Area
Purchase History
| Date | Buyer | Sale Price | Title Company |
|---|---|---|---|
| Daulton Kent D | -- | Alamo Title Company | |
| Daulton Kent D | -- | First American Title Co | |
| Wells Dorsa Gale | -- | First American Title Co |
Source: Public Records
Mortgage History
| Date | Status | Borrower | Loan Amount |
|---|---|---|---|
| Open | Daulton Kent D | $117,600 | |
| Previous Owner | Wells Dorsa Gale | $76,000 | |
| Closed | Daulton Kent D | $22,050 | |
| Closed | Daulton Kent D | $0 |
Source: Public Records
Tax History
| Year | Tax Paid | Tax Assessment Tax Assessment Total Assessment is a certain percentage of the fair market value that is determined by local assessors to be the total taxable value of land and additions on the property. | Land | Improvement |
|---|---|---|---|---|
| 2025 | $6,056 | $388,563 | $85,000 | $303,563 |
| 2024 | $6,056 | $388,563 | $85,000 | $303,563 |
| 2023 | $7,253 | $392,892 | $85,000 | $307,892 |
| 2022 | $6,267 | $288,516 | $55,000 | $233,516 |
| 2021 | $7,568 | $291,730 | $55,000 | $236,730 |
| 2020 | $6,839 | $266,120 | $55,000 | $211,120 |
| 2019 | $7,069 | $268,939 | $55,000 | $213,939 |
| 2018 | $5,937 | $250,784 | $55,000 | $195,784 |
| 2017 | $6,464 | $252,000 | $55,001 | $196,999 |
| 2016 | $5,876 | $234,522 | $40,000 | $194,522 |
| 2015 | $4,912 | $200,200 | $25,000 | $175,200 |
| 2014 | $4,912 | $200,200 | $25,000 | $175,200 |
Source: Public Records
Map
Nearby Homes
- 2925 Ridgewood Dr
- 4900 Rockrimmon Ct
- 203 W Greenbriar Ln
- 717 Ashley Dr
- 3220 David Dr
- 2620 Brookridge Dr
- 712 Springhill Dr
- 108 Glade Rd
- 3229 David Dr
- 2701 Hurstview Dr
- 112 Glade Rd
- 4108 Wellington Dr
- 716 Bridget Way
- 736 Springhill Dr
- 3716 Sweetbriar Ln
- 753 Toni Dr
- 6708 Nob Hill Ct
- 6704 Nob Hill Ct
- 3308 Texas Trail Ct
- 504 Bridlewood N
- 409 Bremen Dr
- 324 Heneretta Dr
- 333 Heneretta Dr
- 420 Bremen Dr
- 329 Heneretta Dr
- 424 Bremen Dr
- 416 Bremen Dr
- 320 Heneretta Dr
- 325 Heneretta Dr
- 401 Heneretta Dr
- 412 Bremen Dr
- 401 Bremen Dr
- 321 Heneretta Dr
- 332 Marseille Dr
- 405 Heneretta Dr
- 328 Marseille Dr
- 316 Heneretta Dr
- 321 Bremen Dr
- 408 Bremen Dr
- 324 Marseille Dr
Your Personal Tour Guide
Ask me questions while you tour the home.