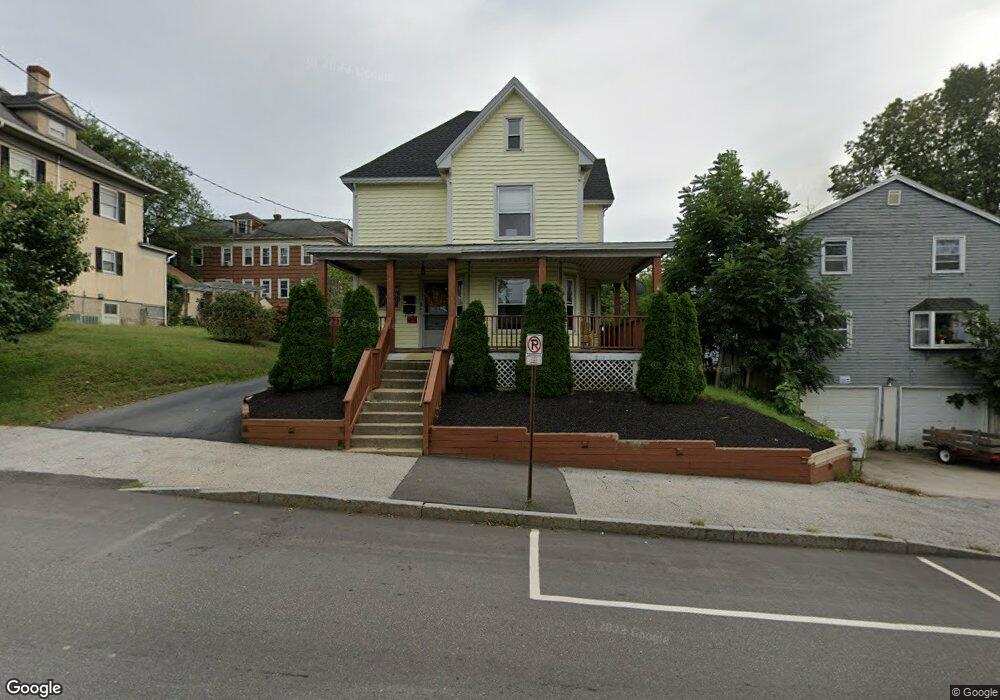
413 Bridge St Manchester, NH 03104
Hanover Hill NeighborhoodEstimated Value: $493,428 - $566,000
4
Beds
2
Baths
2,020
Sq Ft
$261/Sq Ft
Est. Value
About This Home
This home is located at 413 Bridge St, Manchester, NH 03104 and is currently estimated at $526,357, approximately $260 per square foot. 413 Bridge St is a home located in Hillsborough County with nearby schools including McDonough Elementary School, Hillside Middle School, and Manchester Central High School.
Ownership History
Date
Name
Owned For
Owner Type
Purchase Details
Closed on
Nov 18, 2024
Sold by
Wong Kenneth T and Wong Nicole D
Bought by
Wong Ft and Wong
Current Estimated Value
Purchase Details
Closed on
Jun 27, 2001
Sold by
Maes Kevin G and Maes Deborah B
Bought by
Wong Kenneth T
Home Financials for this Owner
Home Financials are based on the most recent Mortgage that was taken out on this home.
Original Mortgage
$94,000
Interest Rate
7.14%
Create a Home Valuation Report for This Property
The Home Valuation Report is an in-depth analysis detailing your home's value as well as a comparison with similar homes in the area
Home Values in the Area
Average Home Value in this Area
Purchase History
| Date | Buyer | Sale Price | Title Company |
|---|---|---|---|
| Wong Ft | -- | None Available | |
| Wong Ft | -- | None Available | |
| Wong Kenneth T | $117,500 | -- | |
| Wong Kenneth T | $117,500 | -- |
Source: Public Records
Mortgage History
| Date | Status | Borrower | Loan Amount |
|---|---|---|---|
| Previous Owner | Wong Kenneth T | $204,300 | |
| Previous Owner | Wong Kenneth T | $60,000 | |
| Previous Owner | Wong Kenneth T | $94,000 |
Source: Public Records
Tax History Compared to Growth
Tax History
| Year | Tax Paid | Tax Assessment Tax Assessment Total Assessment is a certain percentage of the fair market value that is determined by local assessors to be the total taxable value of land and additions on the property. | Land | Improvement |
|---|---|---|---|---|
| 2024 | $6,403 | $327,000 | $89,700 | $237,300 |
| 2023 | $6,167 | $327,000 | $89,700 | $237,300 |
| 2022 | $5,964 | $327,000 | $89,700 | $237,300 |
| 2021 | $5,781 | $327,000 | $89,700 | $237,300 |
| 2020 | $4,942 | $200,400 | $65,100 | $135,300 |
| 2019 | $4,874 | $200,400 | $65,100 | $135,300 |
| 2018 | $4,691 | $200,400 | $65,100 | $135,300 |
| 2017 | $4,490 | $200,400 | $65,100 | $135,300 |
| 2016 | $2,743 | $200,400 | $65,100 | $135,300 |
| 2015 | $4,271 | $182,200 | $65,100 | $117,100 |
| 2014 | $4,282 | $182,200 | $65,100 | $117,100 |
| 2013 | $4,130 | $182,200 | $65,100 | $117,100 |
Source: Public Records
Map
Nearby Homes
- 409 Bridge St
- 419 Bridge St
- 405 Bridge St
- 405 Bridge St Unit 2
- 704 Beacon St
- 438 E High St
- 401 Bridge St
- 401 Bridge St Unit 2
- 426 E High St
- 430 E High St
- 719 Beacon St
- 398 Bridge St
- 686 Beacon St
- 707 Beacon St
- 699 Beacon St
- 653 Belmont St
- 394 Bridge St
- 420 E High St
- 649 Belmont St Unit 1
- 649 Belmont St