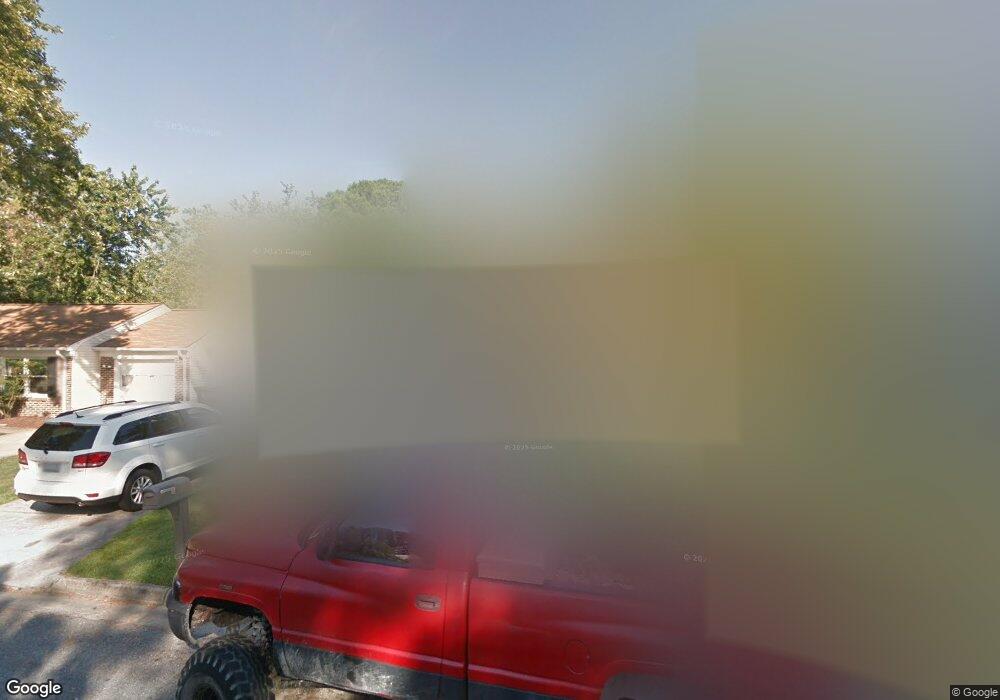
413 Chowan Place Newport News, VA 23608
Richneck NeighborhoodEstimated Value: $274,000 - $296,983
3
Beds
2
Baths
1,300
Sq Ft
$222/Sq Ft
Est. Value
About This Home
This home is located at 413 Chowan Place, Newport News, VA 23608 and is currently estimated at $287,996, approximately $221 per square foot. 413 Chowan Place is a home located in Newport News City with nearby schools including Richneck Elementary School, Ella Fitzgerald Middle School, and Woodside High School.
Ownership History
Date
Name
Owned For
Owner Type
Purchase Details
Closed on
Apr 8, 2020
Sold by
Zi Hla W
Bought by
Diamantino Fernando and Calderon Chayita Maya
Current Estimated Value
Home Financials for this Owner
Home Financials are based on the most recent Mortgage that was taken out on this home.
Original Mortgage
$199,485
Outstanding Balance
$176,336
Interest Rate
3.4%
Mortgage Type
VA
Estimated Equity
$111,660
Purchase Details
Closed on
Oct 23, 2019
Sold by
Penstar Realty Corp
Bought by
Zi Hla W
Home Financials for this Owner
Home Financials are based on the most recent Mortgage that was taken out on this home.
Original Mortgage
$112,891
Interest Rate
3.75%
Mortgage Type
FHA
Purchase Details
Closed on
Apr 28, 2005
Sold by
Varga Kathryn
Bought by
Enoch Bradley
Home Financials for this Owner
Home Financials are based on the most recent Mortgage that was taken out on this home.
Original Mortgage
$121,600
Interest Rate
6.01%
Mortgage Type
New Conventional
Create a Home Valuation Report for This Property
The Home Valuation Report is an in-depth analysis detailing your home's value as well as a comparison with similar homes in the area
Home Values in the Area
Average Home Value in this Area
Purchase History
| Date | Buyer | Sale Price | Title Company |
|---|---|---|---|
| Diamantino Fernando | $195,000 | Priority Title | |
| Zi Hla W | $115,000 | Attorney | |
| Enoch Bradley | $152,000 | -- |
Source: Public Records
Mortgage History
| Date | Status | Borrower | Loan Amount |
|---|---|---|---|
| Open | Diamantino Fernando | $199,485 | |
| Previous Owner | Zi Hla W | $112,891 | |
| Previous Owner | Enoch Bradley | $121,600 |
Source: Public Records
Tax History Compared to Growth
Tax History
| Year | Tax Paid | Tax Assessment Tax Assessment Total Assessment is a certain percentage of the fair market value that is determined by local assessors to be the total taxable value of land and additions on the property. | Land | Improvement |
|---|---|---|---|---|
| 2025 | $3,318 | $272,700 | $69,600 | $203,100 |
| 2024 | $3,171 | $268,700 | $69,600 | $199,100 |
| 2023 | $3,047 | $245,800 | $69,600 | $176,200 |
| 2022 | $2,894 | $228,900 | $69,600 | $159,300 |
| 2021 | $2,395 | $196,300 | $58,000 | $138,300 |
| 2020 | $2,051 | $156,100 | $58,000 | $98,100 |
| 2019 | $1,969 | $149,700 | $58,000 | $91,700 |
| 2018 | $1,819 | $137,700 | $58,000 | $79,700 |
| 2017 | $1,819 | $137,700 | $58,000 | $79,700 |
| 2016 | $1,815 | $137,700 | $58,000 | $79,700 |
| 2015 | $1,809 | $137,700 | $58,000 | $79,700 |
| 2014 | $1,568 | $137,700 | $58,000 | $79,700 |
Source: Public Records
Map
Nearby Homes
- 408 Chowan Place
- 421 Richneck Rd
- 962 Red Oak Cir
- 844 Melrose Terrace
- 12 Chowan Place
- 802 Purdey Ct
- 471 Richneck Rd
- 808 Melrose Terrace
- 202 Tower Ln
- 712 Princess Ct
- 500 Richneck Rd
- 708 Princess Ct
- 425 Truxtun Ct
- 182 Ridgewood Pkwy
- 882 Belvoir Cir
- 9 Friedman Place
- 925 Chartwell Dr
- 1542 Stanford Ln
- 1541 Waltham Ln
- 13025 Green Grove Ln
- 411 Chowan Place
- 415 Chowan Place
- 412 Cottonwood St
- 414 Cottonwood St
- 417 Chowan Place
- 409 Chowan Place
- 416 Cottonwood St
- 408 Cottonwood St
- 419 Chowan Place
- 407 Chowan Place
- 412 Chowan Place
- 418 Cottonwood St
- 406 Cottonwood St
- 414 Chowan Place
- 410 Chowan Place
- 421 Chowan Place
- 405 Chowan Place
- 415 Cottonwood St
- 416 Chowan Place
- 417 Cottonwood St