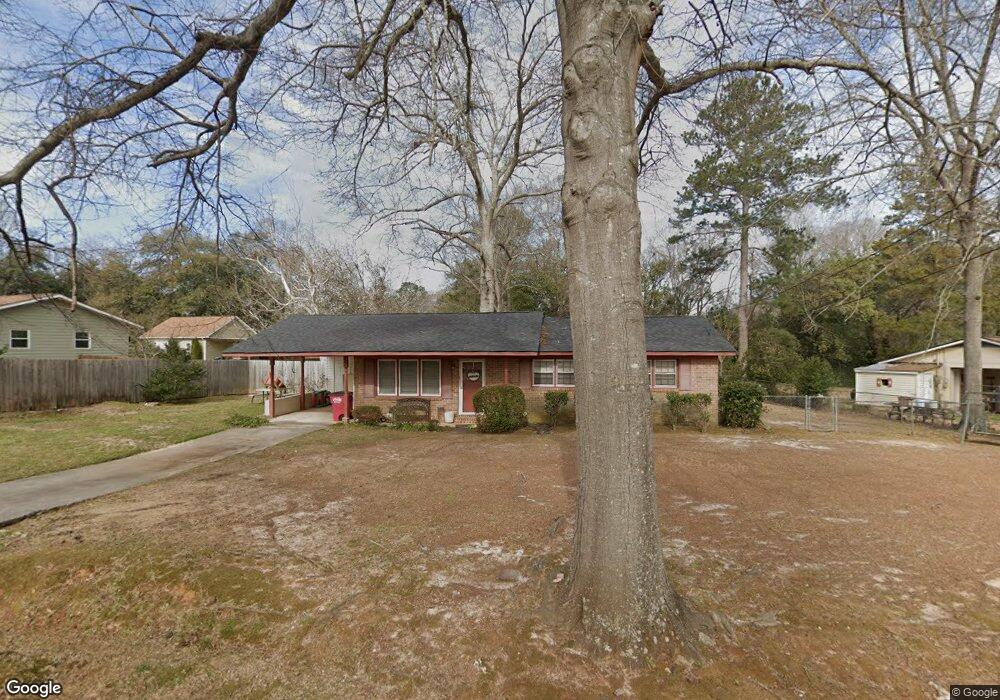
413 Davis Dr Centerville, GA 31028
Estimated Value: $160,000 - $422,000
3
Beds
2
Baths
1,112
Sq Ft
$207/Sq Ft
Est. Value
About This Home
This home is located at 413 Davis Dr, Centerville, GA 31028 and is currently estimated at $230,289, approximately $207 per square foot. 413 Davis Dr is a home located in Houston County with nearby schools including Centerville Elementary School, Thomson Middle School, and Northside High School.
Ownership History
Date
Name
Owned For
Owner Type
Purchase Details
Closed on
Dec 27, 1988
Sold by
Mixon Frank L and Mixon Shelby P
Bought by
Mixon Shelby J
Current Estimated Value
Purchase Details
Closed on
Jun 22, 1973
Sold by
Kellog Roger F and Mary Ellen
Bought by
Mixon Frank L and Mixon Shelby P
Purchase Details
Closed on
Nov 30, 1971
Sold by
Mason James S and Mason Ann B
Bought by
Kellog Roger F and Mary Ellen
Purchase Details
Closed on
Jan 6, 1971
Sold by
Hartley Harley R and Hartley Elvira J
Bought by
Mason James S and Mason Ann B
Purchase Details
Closed on
Jul 10, 1970
Sold by
Master-Bilt Components Inc
Bought by
Hartley Harley R and Hartley Elvira J
Purchase Details
Closed on
Feb 10, 1970
Sold by
Warner Robins Supply Co Inc
Bought by
Master-Bilt Components Inc
Purchase Details
Closed on
Dec 16, 1969
Sold by
Brown Larry J
Bought by
Warner Robins Supply Co Inc
Purchase Details
Closed on
Mar 31, 1967
Sold by
Roseburg Roseburg J and Roseburg
Bought by
Brown Larry J
Create a Home Valuation Report for This Property
The Home Valuation Report is an in-depth analysis detailing your home's value as well as a comparison with similar homes in the area
Home Values in the Area
Average Home Value in this Area
Purchase History
| Date | Buyer | Sale Price | Title Company |
|---|---|---|---|
| Mixon Shelby J | -- | -- | |
| Mixon Frank L | -- | -- | |
| Kellog Roger F | -- | -- | |
| Mason James S | -- | -- | |
| Hartley Harley R | -- | -- | |
| Master-Bilt Components Inc | $500 | -- | |
| Warner Robins Supply Co Inc | $13,000 | -- | |
| Brown Larry J | -- | -- |
Source: Public Records
Tax History
| Year | Tax Paid | Tax Assessment Tax Assessment Total Assessment is a certain percentage of the fair market value that is determined by local assessors to be the total taxable value of land and additions on the property. | Land | Improvement |
|---|---|---|---|---|
| 2024 | $1,505 | $43,400 | $6,800 | $36,600 |
| 2023 | $1,261 | $36,080 | $6,800 | $29,280 |
| 2022 | $500 | $30,880 | $6,000 | $24,880 |
| 2021 | $421 | $27,360 | $6,000 | $21,360 |
| 2020 | $376 | $25,320 | $6,000 | $19,320 |
| 2019 | $542 | $25,320 | $6,000 | $19,320 |
| 2018 | $542 | $25,320 | $6,000 | $19,320 |
| 2017 | $542 | $25,320 | $6,000 | $19,320 |
| 2016 | $543 | $25,320 | $6,000 | $19,320 |
| 2015 | $544 | $25,320 | $6,000 | $19,320 |
| 2014 | -- | $24,840 | $6,000 | $18,840 |
| 2013 | -- | $24,840 | $6,000 | $18,840 |
Source: Public Records
Map
Nearby Homes
- 110 Lee St
- 102 Lee St Unit 117 Wilson Drive
- 102 Lee St
- 214 Mcvey Trail
- 114 Collins Estate Ave
- 107 Miller Ct
- 105 Parker Ln
- 200 Collins Estate Ave
- 708 N Houston Lake Blvd
- 111 Shamrock Dr
- 400 S Cambridge Dr
- 208 Bassett St
- 202 Bassett St
- 109 Calvin Ct
- 121 Crestwood Rd
- 132 Montrose Ln
- 222 Ridgewood Dr
- 100 Jamestown Ct
- 204 S Cambridge Dr
- 117 Crestwood Ct
Your Personal Tour Guide
Ask me questions while you tour the home.