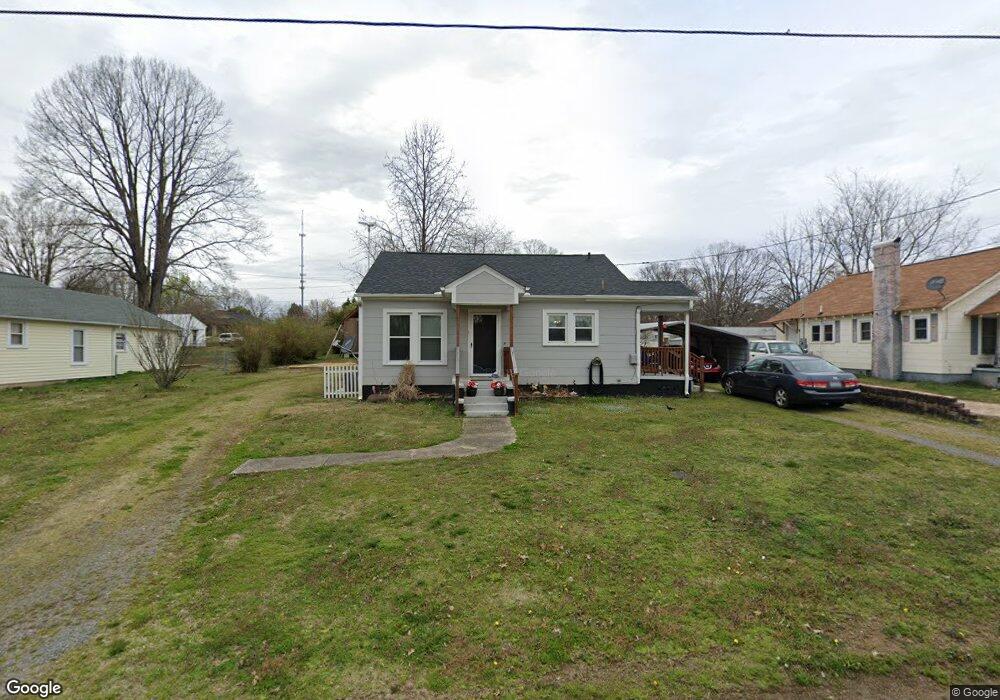
413 E 23rd St Kannapolis, NC 28083
Estimated Value: $152,000 - $181,000
2
Beds
1
Bath
900
Sq Ft
$186/Sq Ft
Est. Value
About This Home
This home is located at 413 E 23rd St, Kannapolis, NC 28083 and is currently estimated at $167,550, approximately $186 per square foot. 413 E 23rd St is a home located in Rowan County with nearby schools including Landis Elementary School, Corriher Lipe Middle School, and South Rowan High School.
Ownership History
Date
Name
Owned For
Owner Type
Purchase Details
Closed on
Jun 16, 2016
Sold by
Stofford Joel L and Stofford Minta
Bought by
Perkins Brenda
Current Estimated Value
Home Financials for this Owner
Home Financials are based on the most recent Mortgage that was taken out on this home.
Original Mortgage
$61,900
Outstanding Balance
$50,328
Interest Rate
4.25%
Mortgage Type
Adjustable Rate Mortgage/ARM
Estimated Equity
$117,222
Purchase Details
Closed on
Mar 4, 2011
Sold by
Fannie Mae
Bought by
Stofford Joel and Stofford Minta
Home Financials for this Owner
Home Financials are based on the most recent Mortgage that was taken out on this home.
Original Mortgage
$16,000
Interest Rate
4.99%
Mortgage Type
Future Advance Clause Open End Mortgage
Purchase Details
Closed on
Sep 20, 2010
Sold by
King Gina
Bought by
Federal National Mortgage Association
Create a Home Valuation Report for This Property
The Home Valuation Report is an in-depth analysis detailing your home's value as well as a comparison with similar homes in the area
Home Values in the Area
Average Home Value in this Area
Purchase History
| Date | Buyer | Sale Price | Title Company |
|---|---|---|---|
| Perkins Brenda | $60,000 | None Available | |
| Stofford Joel | -- | None Available | |
| Federal National Mortgage Association | $79,345 | None Available |
Source: Public Records
Mortgage History
| Date | Status | Borrower | Loan Amount |
|---|---|---|---|
| Open | Perkins Brenda | $61,900 | |
| Previous Owner | Stofford Joel | $16,000 |
Source: Public Records
Tax History
| Year | Tax Paid | Tax Assessment Tax Assessment Total Assessment is a certain percentage of the fair market value that is determined by local assessors to be the total taxable value of land and additions on the property. | Land | Improvement |
|---|---|---|---|---|
| 2025 | $1,180 | $97,558 | $22,725 | $74,833 |
| 2024 | $1,180 | $97,558 | $22,725 | $74,833 |
| 2023 | $1,180 | $97,558 | $22,725 | $74,833 |
| 2022 | $827 | $64,243 | $18,938 | $45,305 |
| 2021 | $827 | $64,243 | $18,938 | $45,305 |
| 2020 | $827 | $64,243 | $18,938 | $45,305 |
| 2019 | $827 | $64,243 | $18,938 | $45,305 |
| 2018 | $761 | $59,780 | $18,937 | $40,843 |
| 2017 | $761 | $59,780 | $18,937 | $40,843 |
| 2016 | $655 | $51,452 | $18,937 | $32,515 |
| 2015 | $665 | $51,452 | $18,937 | $32,515 |
| 2014 | $643 | $51,402 | $17,422 | $33,980 |
Source: Public Records
Map
Nearby Homes
- 408 E 22nd St
- 2210 N Cannon Blvd
- 494 E 22nd St
- 400 E 27th St
- 323 E 20th St
- 00 E 22nd St
- 2003 Plaza Ave
- 2410 Summit Ave
- 2809 N Main St
- 2406 Brookside Ave
- 2417 Summit Ave
- 513 Sand Dunes Dr
- 286 W 18th St
- 292 W 18th St
- 252 W 18th St
- 537 Sand Dunes Dr
- 310 W 18th St
- 526 Sand Dunes Dr
- 221 W 18th St
- 295 W 18th St
Your Personal Tour Guide
Ask me questions while you tour the home.