Highlights
- Property is near public transit and shops
- No HOA
- Central Heating and Cooling System
- Wood Flooring
- Laundry closet
About This Home
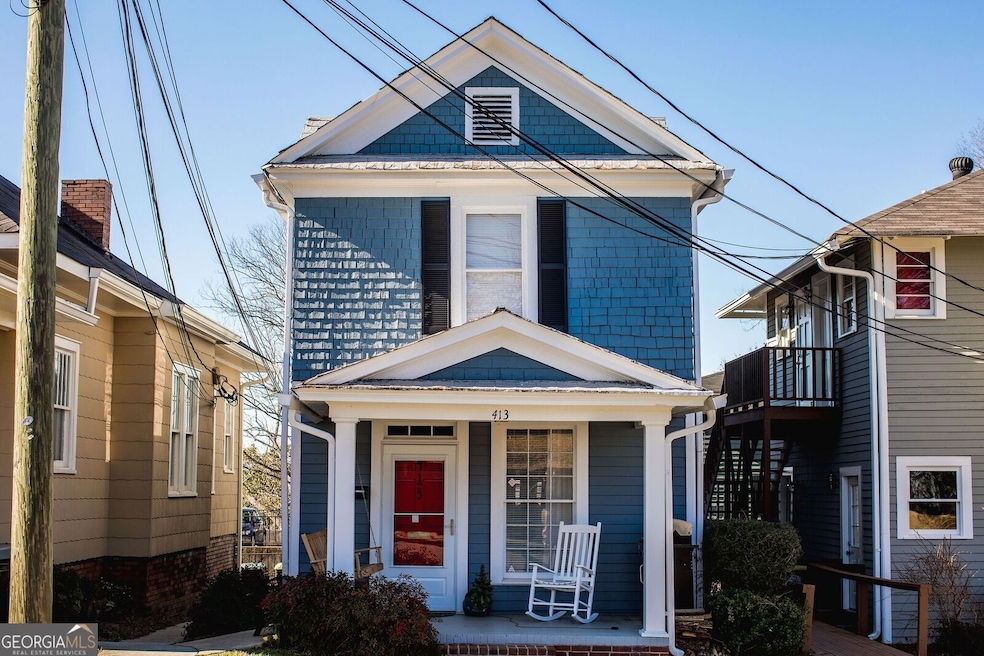
Enjoy clock tower view right from your front porch. Charming 2 bedroom 1.5 bath house located in the heart of historic downtown. Walking distance to local dining and shopping. Stove, refrigerator, dishwasher, non-warranted washer/dryer, central heat & air, lawn care & parking provided. No Pets. **All applications are to be submitted through the Hardy Realty website.
Listing Agent
Hardy Realty & Development Company License #123269 Listed on: 12/10/2025
Home Details
Home Type
- Single Family
Year Built
- Built in 1965
Parking
- Off-Street Parking
Home Design
- Composition Roof
Interior Spaces
- 1,173 Sq Ft Home
- 2-Story Property
- Wood Flooring
Kitchen
- Oven or Range
- Dishwasher
Bedrooms and Bathrooms
- 2 Main Level Bedrooms
Laundry
- Laundry closet
- Dryer
- Washer
Schools
- Main Elementary School
- Rome Middle School
- Rome High School
Utilities
- Central Heating and Cooling System
- Cable TV Available
Additional Features
- 1,742 Sq Ft Lot
- Property is near public transit and shops
Listing and Financial Details
- Security Deposit $1,000
- $30 Application Fee
Community Details
Overview
- No Home Owners Association
Pet Policy
- No Pets Allowed
Map
Property History
| Date | Event | Price | List to Sale | Price per Sq Ft |
|---|---|---|---|---|
| 02/13/2026 02/13/26 | Price Changed | $1,375 | -5.2% | $1 / Sq Ft |
| 12/10/2025 12/10/25 | For Rent | $1,450 | -- | -- |
Source: Georgia MLS
MLS Number: 10655871
APN: J14C-158
Disclaimer: Certain information contained herein is derived from information provided by parties other than Homes.com. All information provided is deemed reliable, but is not guaranteed to be accurate and should be independently verified.
![]() The data relating to real estate for sale on this web site comes in part from the Broker Reciprocity Program of Georgia MLS. Real estate listings held by brokerage firms other than Redfin are marked with the Broker Reciprocity logo and detailed information about them includes the name of the listing brokers. Information deemed reliable but not guaranteed. Copyright 2026 Georgia MLS. All rights reserved.
The data relating to real estate for sale on this web site comes in part from the Broker Reciprocity Program of Georgia MLS. Real estate listings held by brokerage firms other than Redfin are marked with the Broker Reciprocity logo and detailed information about them includes the name of the listing brokers. Information deemed reliable but not guaranteed. Copyright 2026 Georgia MLS. All rights reserved.
- 204 E 5th Ave
- 407 E 3rd St
- 501 E 3rd St
- 202 E 4th Ave Unit 5
- 167 Sweet Water Ln
- 312 E 3rd St
- 1 E 3rd Ave Unit 302
- 633 E 3rd St
- 10 E 3rd Ave
- 8 E 3rd Ave
- 214 E 3rd St
- 29 Pear St
- 138 E 8th Ave Unit 25
- 320 E 3rd Ave
- 0 Brook Valley Ct Unit 10665224
- 0 Brook Valley Ct Unit 7698646
- 102 Smith St NE
- 715 Avenue A NE
- 232 S Broad St SW
- 105 Mary St SW
- 102 E 5th Ave Unit B
- 320 E 5th Ave
- 114 Broad St Unit 208
- 340 W 3rd St SW
- 712 Avenue A NE
- 707 E 2nd Ave
- 1106 Avenue B Unit A
- 12 Morningside Dr SW
- 600 S Broad St SW
- 525 W 13th St NE
- 1005 N 2nd Ave NW
- 11 N McLin St SW
- 1101 Park Blvd SE
- 2310 Village Blvd SE
- 204 Oakwood St NW
- 2101 Southern St NE Unit A
- 2522 Callier Springs Rd SE
- 14 1/2 Tumlin Dr
- 220 Chatillon Rd NE
- 313 Timothy Ave

Ask me questions while you tour the home.