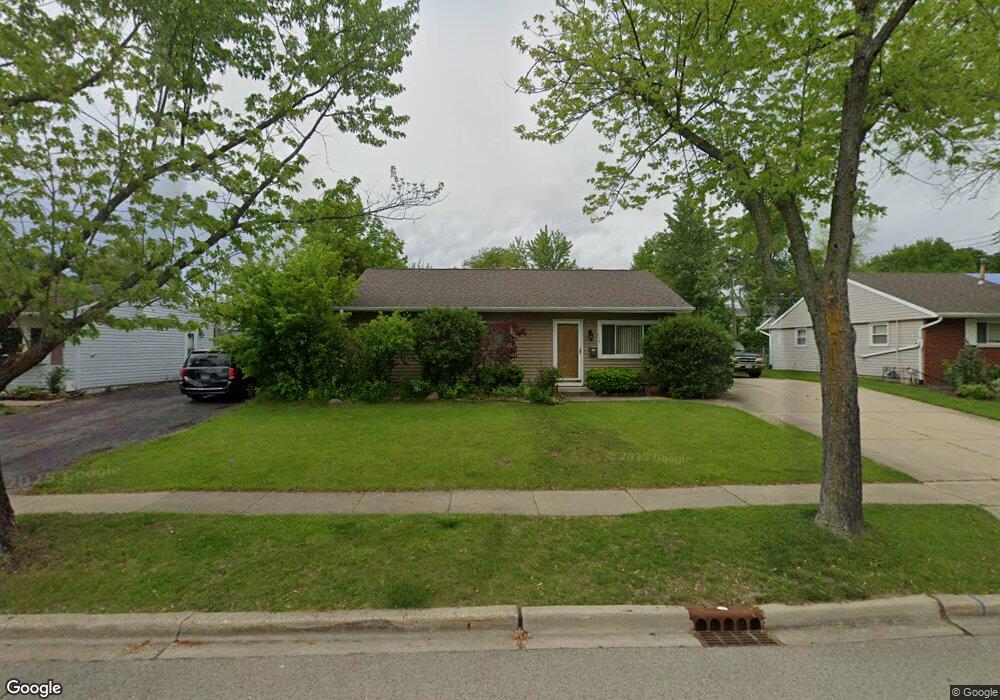
413 E Streamwood Blvd Streamwood, IL 60107
Woodland Heights NeighborhoodEstimated Value: $282,000 - $303,000
3
Beds
1
Bath
986
Sq Ft
$296/Sq Ft
Est. Value
About This Home
This home is located at 413 E Streamwood Blvd, Streamwood, IL 60107 and is currently estimated at $292,238, approximately $296 per square foot. 413 E Streamwood Blvd is a home located in Cook County with nearby schools including Oakhill Elementary School, Canton Middle School, and Streamwood High School.
Ownership History
Date
Name
Owned For
Owner Type
Purchase Details
Closed on
Nov 22, 2004
Sold by
Reid Harris Diana S and Reid Diana
Bought by
Harris Donovan B and Reid Harris Diana S
Current Estimated Value
Home Financials for this Owner
Home Financials are based on the most recent Mortgage that was taken out on this home.
Original Mortgage
$167,475
Outstanding Balance
$82,055
Interest Rate
5.82%
Mortgage Type
FHA
Estimated Equity
$210,183
Purchase Details
Closed on
Jun 28, 2001
Sold by
Martoccia John and Martoccia Darlene B
Bought by
Reid Diana
Home Financials for this Owner
Home Financials are based on the most recent Mortgage that was taken out on this home.
Original Mortgage
$132,000
Interest Rate
7.75%
Mortgage Type
Adjustable Rate Mortgage/ARM
Purchase Details
Closed on
Sep 5, 1996
Sold by
Sjodin Ronald S
Bought by
Martoccia John and Martoccia Darlene B
Home Financials for this Owner
Home Financials are based on the most recent Mortgage that was taken out on this home.
Original Mortgage
$117,127
Interest Rate
8.27%
Mortgage Type
FHA
Create a Home Valuation Report for This Property
The Home Valuation Report is an in-depth analysis detailing your home's value as well as a comparison with similar homes in the area
Home Values in the Area
Average Home Value in this Area
Purchase History
| Date | Buyer | Sale Price | Title Company |
|---|---|---|---|
| Harris Donovan B | -- | Multiple | |
| Reid Diana | $165,000 | Chicago Title Insurance Co | |
| Martoccia John | $118,000 | -- |
Source: Public Records
Mortgage History
| Date | Status | Borrower | Loan Amount |
|---|---|---|---|
| Open | Harris Donovan B | $167,475 | |
| Closed | Reid Diana | $132,000 | |
| Previous Owner | Martoccia John | $117,127 |
Source: Public Records
Tax History
| Year | Tax Paid | Tax Assessment Tax Assessment Total Assessment is a certain percentage of the fair market value that is determined by local assessors to be the total taxable value of land and additions on the property. | Land | Improvement |
|---|---|---|---|---|
| 2025 | $5,447 | $25,000 | $6,916 | $18,084 |
| 2024 | $5,447 | $21,000 | $4,940 | $16,060 |
| 2023 | $5,273 | $21,000 | $4,940 | $16,060 |
| 2022 | $5,273 | $21,000 | $4,940 | $16,060 |
| 2021 | $4,534 | $15,734 | $3,458 | $12,276 |
| 2020 | $4,540 | $15,734 | $3,458 | $12,276 |
| 2019 | $4,553 | $17,679 | $3,458 | $14,221 |
| 2018 | $3,664 | $13,840 | $2,964 | $10,876 |
| 2017 | $3,635 | $13,840 | $2,964 | $10,876 |
| 2016 | $3,674 | $13,840 | $2,964 | $10,876 |
| 2015 | $4,319 | $14,801 | $2,717 | $12,084 |
| 2014 | $4,273 | $14,801 | $2,717 | $12,084 |
| 2013 | $4,120 | $14,801 | $2,717 | $12,084 |
Source: Public Records
Map
Nearby Homes
- 401 Concord Dr
- 416 Concord Dr
- 400 Country Ln
- 213 Villa Rd
- 205 Villa Rd
- 218 Mayfield Dr Unit 4
- 120 Grow Ln
- 13 S Victoria Ln
- 110 Elm Ln
- 317 E Schaumburg Rd
- 110 Cedar Cir
- 804 Hillside Dr
- 111 Cedar Cir
- 305 S Bartlett Rd
- 58 Marion Ln
- 28 Chaucer Ln
- 11 E Streamwood Blvd
- 906 E Streamwood Blvd
- 501 Newberry Dr
- 543 Ridge Cir
- 415 E Streamwood Blvd
- 411 E Streamwood Blvd
- 309 Chase Terrace
- 307 Chase Terrace
- 417 E Streamwood Blvd
- 305 Chase Terrace
- 409 E Streamwood Blvd
- 402 Beaver Dr
- 311 Chase Terrace
- 313 Chase Terrace
- 404 Beaver Dr
- 315 Chase Terrace
- 314 Chase Terrace
- 304 Chase Terrace
- 401 Beaver Dr
- 405 E Streamwood Blvd Unit 9
- 406 Beaver Dr
- 317 Chase Terrace
- 302 Chase Terrace
- 316 Chase Terrace
Your Personal Tour Guide
Ask me questions while you tour the home.