Estimated payment $1,512/month
About This Lot
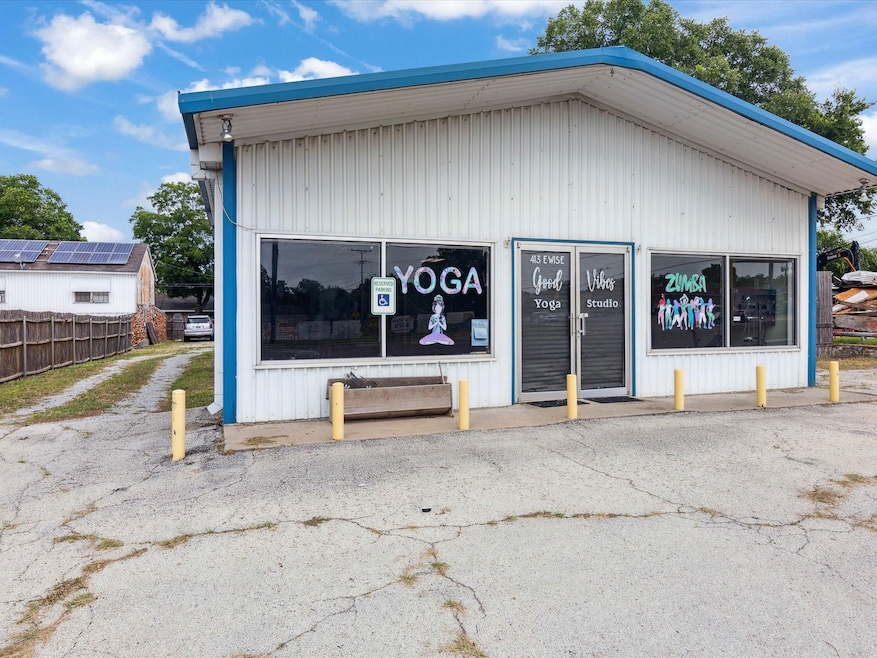
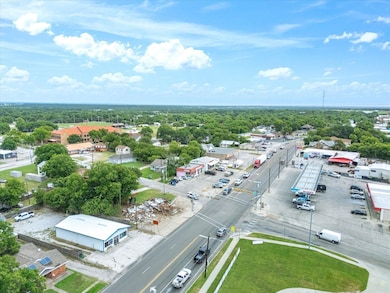
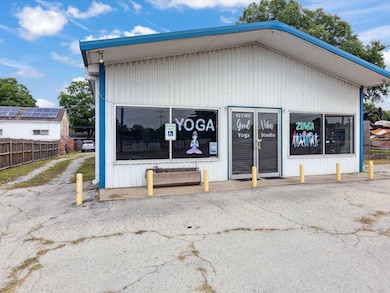
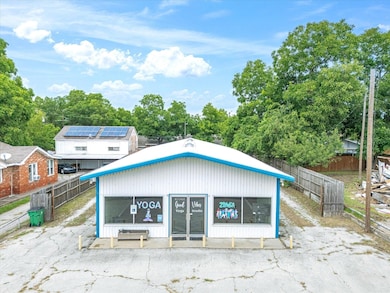
Prime Commercial Property in the Heart of Bowie!
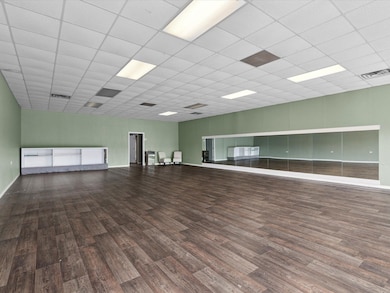
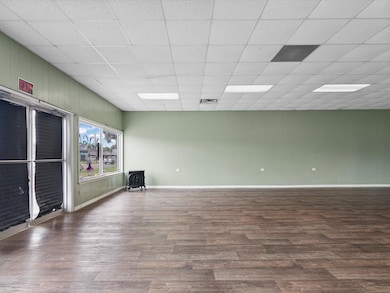
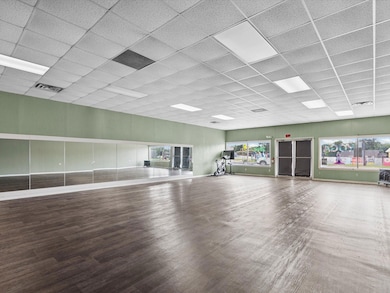
Don't miss this incredible opportunity to own a high-visibility building located right on the main street running through Bowie. 60x30 metal building with excellent street frontage, a high traffic count, and outstanding visibility, this property offers endless potential for a wide range of uses. Whether you're looking to open a retail store, restaurant, coffee shop, or establish your next business venture, this location is ideal. The property is conveniently located near other businesses, making it a perfect spot for attracting both local customers and through-traffic. Endless possibilities awaitideal for investors, entrepreneurs, or established businesses looking to expand. With its fantastic location and flexible layout, this property wont stay on the market for long! Schedule your showing today and turn your vision into reality in one of Bowie's most sought-after locations!

Property Details
Property Type
- Land
Map
Home Values in the Area
Average Home Value in this Area
Tax History
| Year | Tax Paid | Tax Assessment Tax Assessment Total Assessment is a certain percentage of the fair market value that is determined by local assessors to be the total taxable value of land and additions on the property. | Land | Improvement |
|---|---|---|---|---|
| 2025 | $2,510 | $133,110 | $53,990 | $79,120 |
| 2024 | $2,538 | $134,550 | $53,990 | $80,560 |
| 2023 | $2,477 | $129,230 | $53,990 | $75,240 |
| 2022 | $2,690 | $129,230 | $53,990 | $75,240 |
| 2021 | $2,914 | $129,230 | $53,990 | $75,240 |
| 2020 | $2,901 | $129,230 | $53,990 | $75,240 |
| 2019 | $2,966 | $129,230 | $53,990 | $75,240 |
| 2018 | $2,867 | $124,640 | $53,990 | $70,650 |
| 2017 | $2,940 | $131,120 | $53,990 | $77,130 |
| 2016 | $2,326 | $103,720 | $53,990 | $49,730 |
| 2015 | -- | $103,720 | $53,990 | $49,730 |
| 2014 | -- | $61,110 | $11,380 | $49,730 |
Property History
| Date | Event | Price | List to Sale | Price per Sq Ft |
|---|---|---|---|---|
| 07/07/2025 07/07/25 | For Sale | $249,500 | -- | -- |
Purchase History
| Date | Type | Sale Price | Title Company |
|---|---|---|---|
| Warranty Deed | -- | None Available | |
| Special Warranty Deed | -- | None Available | |
| Special Warranty Deed | -- | None Available |
- 310 E Tarrant St
- 214 E Clay St
- 201 Rock St
- 407 Decatur St
- 308 S Mills St
- 411 Decatur St
- 412 Small St
- Lot 2 Cipriani Ct
- Lot 6 Cipriani Ct
- Lot 3 Cipriani Ct
- Lot 4 Cipriani Ct
- Lot 5 Cipriani Ct
- Bowie Tx
- 610 Cooper St
- 305 E Nelson St
- 403 Miller St
- 422 Hutchinson St
- 610 N Mason St
- 107 E Riley St
- 305 Ussery St
- 109 E Clay St Unit B
- 1201 E Wise St Unit Studio
- 419 Miller St
- 507 Hodge St
- 109 E Williams St
- 701 Hulme St
- 401 Barker St
- 910 Circle Dr
- 1002 Lowrie St
- 1005 Roberts St
- 802 Old Wise Rd
- 4242 Us Highway 287 Access Rd N Unit Apartment
- 348 Lake Loop
- 1402 Posey Brewer Rd
- 106 County Road 1856
- 600 Scenic Dr
- 404 Leroy St
- 135 Sienna Dr
- 906 El Camino Real Unit 4
- 305 Sierra Vista Dr