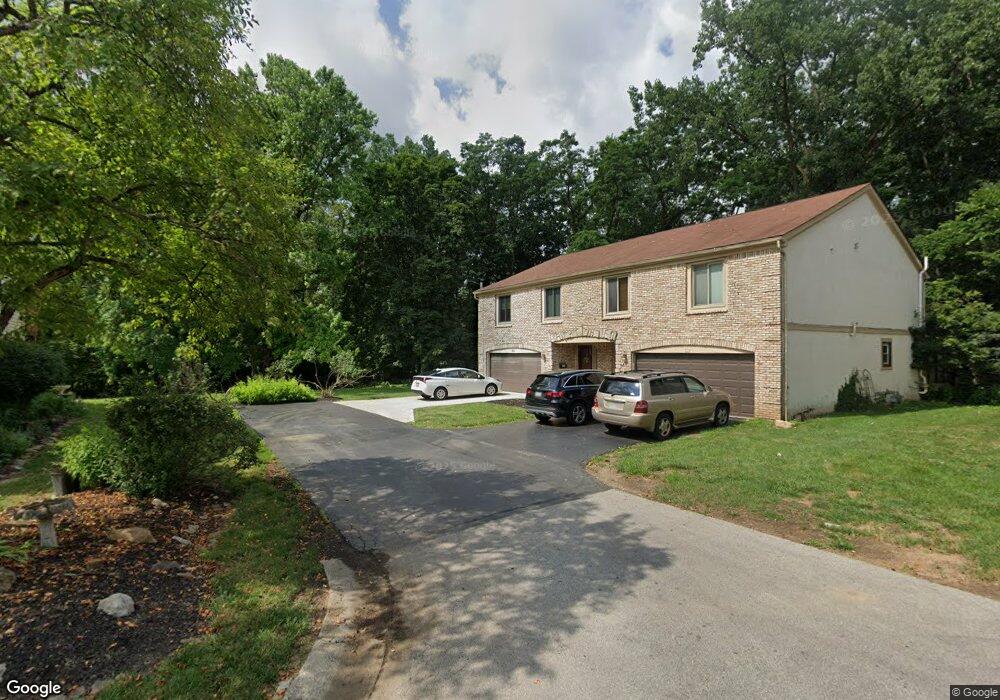
413 Fenway Rd Unit 8A Columbus, OH 43214
Clintonville NeighborhoodEstimated Value: $303,000 - $323,000
3
Beds
3
Baths
1,984
Sq Ft
$158/Sq Ft
Est. Value
About This Home
This home is located at 413 Fenway Rd Unit 8A, Columbus, OH 43214 and is currently estimated at $313,348, approximately $157 per square foot. 413 Fenway Rd Unit 8A is a home located in Franklin County with nearby schools including Indian Springs Elementary School, Dominion Middle School, and Whetstone High School.
Ownership History
Date
Name
Owned For
Owner Type
Purchase Details
Closed on
Jun 19, 2017
Sold by
Rhaloui Abdelkrim
Bought by
Schultz Jordan R
Current Estimated Value
Home Financials for this Owner
Home Financials are based on the most recent Mortgage that was taken out on this home.
Original Mortgage
$94,900
Interest Rate
3.9%
Mortgage Type
New Conventional
Purchase Details
Closed on
Aug 30, 2011
Sold by
Hart Joanna L
Bought by
Rhaloui Abdelkrim
Home Financials for this Owner
Home Financials are based on the most recent Mortgage that was taken out on this home.
Original Mortgage
$82,514
Interest Rate
4.64%
Mortgage Type
Purchase Money Mortgage
Purchase Details
Closed on
Jul 6, 1993
Bought by
Hart Joanna L
Purchase Details
Closed on
Mar 12, 1992
Purchase Details
Closed on
Sep 23, 1987
Create a Home Valuation Report for This Property
The Home Valuation Report is an in-depth analysis detailing your home's value as well as a comparison with similar homes in the area
Home Values in the Area
Average Home Value in this Area
Purchase History
| Date | Buyer | Sale Price | Title Company |
|---|---|---|---|
| Schultz Jordan R | $184,900 | None Available | |
| Rhaloui Abdelkrim | $97,600 | Chicago | |
| Hart Joanna L | $113,900 | -- | |
| -- | -- | -- | |
| -- | $84,500 | -- |
Source: Public Records
Mortgage History
| Date | Status | Borrower | Loan Amount |
|---|---|---|---|
| Previous Owner | Schultz Jordan R | $94,900 | |
| Previous Owner | Rhaloui Abdelkrim | $82,514 |
Source: Public Records
Tax History Compared to Growth
Tax History
| Year | Tax Paid | Tax Assessment Tax Assessment Total Assessment is a certain percentage of the fair market value that is determined by local assessors to be the total taxable value of land and additions on the property. | Land | Improvement |
|---|---|---|---|---|
| 2024 | $4,215 | $93,910 | $21,000 | $72,910 |
| 2023 | $4,161 | $93,905 | $21,000 | $72,905 |
| 2022 | $3,086 | $59,500 | $9,240 | $50,260 |
| 2021 | $3,091 | $59,500 | $9,240 | $50,260 |
| 2020 | $3,095 | $59,500 | $9,240 | $50,260 |
| 2019 | $3,009 | $49,600 | $7,700 | $41,900 |
| 2018 | $3,016 | $49,600 | $7,700 | $41,900 |
| 2017 | $2,835 | $46,760 | $7,700 | $39,060 |
| 2016 | $3,337 | $50,370 | $9,240 | $41,130 |
| 2015 | $3,029 | $50,370 | $9,240 | $41,130 |
| 2014 | $3,036 | $50,370 | $9,240 | $41,130 |
| 2013 | $1,426 | $47,950 | $8,785 | $39,165 |
Source: Public Records
Map
Nearby Homes
- 5200 Fenway Ct Unit A
- 287 Fenway Rd Unit B
- 511 W Kanawha Ave
- 290 W Kanawha Ave
- 252 W Kanawha Ave
- 4994 Delawanda Ave
- 142 Rosslyn Ave
- 202 Rathbone Ave
- 162 Broad Meadows Blvd
- 131 Broad Meadows Blvd
- 895 Linworth Village Dr
- 5508 Emerson Ave
- 928 Linworth Village Dr
- 5542 Emerson Ave
- 4 W Royal Forest Blvd
- 652 Olde Towne Ave Unit 9-652E
- 652 Olde Towne Ave Unit 9-652 G
- 87 Charleston Ave
- 301 W Riverglen Dr
- 5584 Morning St
- 413 Fenway Rd Unit 419
- 413 Fenway Rd
- 419 Fenway Rd
- 419 Fenway Rd Unit A
- 422 Fenway Rd
- 422 Fenway Rd Unit B
- 407 Fenway Rd Unit 9B
- 407 Fenway Rd Unit B
- 412 Fenway Rd Unit 6A
- 400 Fenway Rd Unit 4A
- 364 Fenway Rd Unit 1B
- 366 Fenway Rd Unit 1A
- 400 Fenway Rd Unit A
- 364 Fenway Rd Unit B
- 416 Fenway Rd Unit 7A
- 376 Fenway Rd Unit 3B
- 410 Fenway Rd Unit 6B
- 370 Fenway Rd
- 376 Fenway Rd Unit B
- 406 Fenway Rd Unit 5A