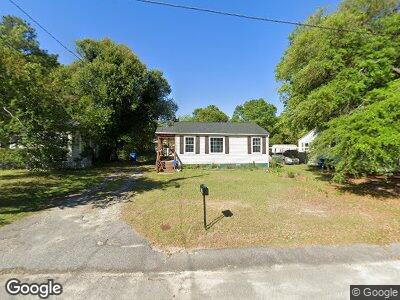
413 Graham St West Columbia, SC 29169
Estimated Value: $205,000 - $237,000
3
Beds
2
Baths
1,346
Sq Ft
$163/Sq Ft
Est. Value
About This Home
This home is located at 413 Graham St, West Columbia, SC 29169 and is currently estimated at $219,495, approximately $163 per square foot. 413 Graham St is a home located in Lexington County with nearby schools including Riverbank Elementary, Northside Middle, and Brookland-Cayce High School.
Ownership History
Date
Name
Owned For
Owner Type
Purchase Details
Closed on
Feb 19, 2020
Sold by
Randall Investments & Services Llc
Bought by
Stankus Georg
Current Estimated Value
Home Financials for this Owner
Home Financials are based on the most recent Mortgage that was taken out on this home.
Original Mortgage
$61,250
Outstanding Balance
$54,920
Interest Rate
3.6%
Mortgage Type
Future Advance Clause Open End Mortgage
Estimated Equity
$152,653
Purchase Details
Closed on
Dec 28, 2018
Sold by
Hallihan John D and Jones Edward S
Bought by
Randall Investments And Services Llc
Purchase Details
Closed on
Sep 8, 2008
Sold by
U S Bank Na
Bought by
Jones Edward and Hallihan John D
Home Financials for this Owner
Home Financials are based on the most recent Mortgage that was taken out on this home.
Original Mortgage
$69,088
Interest Rate
6.45%
Mortgage Type
FHA
Purchase Details
Closed on
Mar 31, 2008
Sold by
Searle Hattie Jean
Bought by
U S Bank Na
Create a Home Valuation Report for This Property
The Home Valuation Report is an in-depth analysis detailing your home's value as well as a comparison with similar homes in the area
Home Values in the Area
Average Home Value in this Area
Purchase History
| Date | Buyer | Sale Price | Title Company |
|---|---|---|---|
| Stankus Georg | $122,500 | None Available | |
| Randall Investments And Services Llc | $66,600 | None Available | |
| Jones Edward | $70,000 | -- | |
| U S Bank Na | $2,500 | -- |
Source: Public Records
Mortgage History
| Date | Status | Borrower | Loan Amount |
|---|---|---|---|
| Open | Stankus Georg | $61,250 | |
| Previous Owner | Jones Edward | $69,088 |
Source: Public Records
Tax History Compared to Growth
Tax History
| Year | Tax Paid | Tax Assessment Tax Assessment Total Assessment is a certain percentage of the fair market value that is determined by local assessors to be the total taxable value of land and additions on the property. | Land | Improvement |
|---|---|---|---|---|
| 2024 | $1,284 | $6,720 | $900 | $5,820 |
| 2023 | $1,284 | $10,080 | $1,350 | $8,730 |
| 2022 | $3,769 | $10,080 | $1,350 | $8,730 |
| 2020 | $914 | $4,925 | $900 | $4,025 |
| 2019 | $1,941 | $5,422 | $1,350 | $4,072 |
| 2018 | $1,925 | $5,422 | $1,350 | $4,072 |
| 2017 | $1,889 | $5,422 | $1,350 | $4,072 |
| 2016 | $1,911 | $5,421 | $1,350 | $4,071 |
| 2014 | $1,529 | $4,990 | $776 | $4,214 |
| 2013 | -- | $4,990 | $780 | $4,210 |
Source: Public Records
Map
Nearby Homes
- 0 Platt Springs Rd Unit 606355
- 0 Platt Springs Rd Unit 605298
- 203 Woodhaven Dr
- 623 Hook Ave
- 213 Greenwood Rd
- 1 Janice Faye Trail
- 217 Congaree Mill Ln
- 146 Sabal Dr
- 2107 Klapman Rd
- 159 Alexandria St
- 258 Gum Swamp Trail
- 348 Gum Swamp Trail
- 1513 Gambrell St
- 139 Silver Run Place
- 141 Silver Run Place
- 175 Silver Run Place
- 212 Alexandria St
- 154 Manning Dr
- 217 Alexandria St
- 0 Sunset Blvd Unit 553428