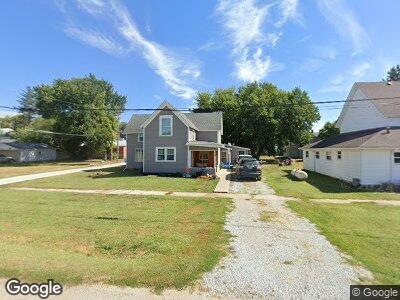
413 Main St Nehawka, NE 68413
Estimated Value: $126,665 - $161,000
5
Beds
2
Baths
2,257
Sq Ft
$64/Sq Ft
Est. Value
About This Home
This home is located at 413 Main St, Nehawka, NE 68413 and is currently estimated at $143,666, approximately $63 per square foot. 413 Main St is a home located in Cass County with nearby schools including Conestoga Elementary School and Conestoga Junior/Senior High School.
Ownership History
Date
Name
Owned For
Owner Type
Purchase Details
Closed on
Jan 11, 2021
Sold by
Weiler Stphanie
Bought by
Ross Brianne M
Current Estimated Value
Home Financials for this Owner
Home Financials are based on the most recent Mortgage that was taken out on this home.
Original Mortgage
$83,460
Outstanding Balance
$75,288
Interest Rate
2.67%
Mortgage Type
FHA
Estimated Equity
$68,378
Purchase Details
Closed on
May 16, 2017
Sold by
Mcafee Jodi and Mcafee Michael
Bought by
Weiler Stephanie J
Purchase Details
Closed on
Oct 3, 2008
Sold by
Primacy Closing Corp
Bought by
Weiler Stephanie
Home Financials for this Owner
Home Financials are based on the most recent Mortgage that was taken out on this home.
Original Mortgage
$70,500
Interest Rate
6.35%
Mortgage Type
Unknown
Purchase Details
Closed on
Jul 18, 2008
Sold by
Chambers Timothy Shawn
Bought by
Primacy Closing Corp
Purchase Details
Closed on
Nov 30, 2001
Sold by
Wessel Rose
Bought by
Chambers Timothy Shawn
Create a Home Valuation Report for This Property
The Home Valuation Report is an in-depth analysis detailing your home's value as well as a comparison with similar homes in the area
Home Values in the Area
Average Home Value in this Area
Purchase History
| Date | Buyer | Sale Price | Title Company |
|---|---|---|---|
| Ross Brianne M | $85,000 | Charter Title | |
| Weiler Stephanie J | -- | None Available | |
| Weiler Stephanie | $42,500 | -- | |
| Primacy Closing Corp | $99,000 | -- | |
| Chambers Timothy Shawn | $50,000 | -- |
Source: Public Records
Mortgage History
| Date | Status | Borrower | Loan Amount |
|---|---|---|---|
| Open | Ross Brianne M | $83,460 | |
| Previous Owner | Weiler Stephanie | $65,979 | |
| Previous Owner | Weiler Stephanie | $70,500 | |
| Previous Owner | Chambers Timothy Shawn | $75,000 |
Source: Public Records
Tax History Compared to Growth
Tax History
| Year | Tax Paid | Tax Assessment Tax Assessment Total Assessment is a certain percentage of the fair market value that is determined by local assessors to be the total taxable value of land and additions on the property. | Land | Improvement |
|---|---|---|---|---|
| 2024 | $1,684 | $102,395 | $4,710 | $97,685 |
| 2023 | $1,764 | $100,654 | $2,969 | $97,685 |
| 2022 | $1,683 | $91,632 | $3,222 | $88,410 |
| 2021 | $1,462 | $77,594 | $3,069 | $74,525 |
| 2020 | $1,468 | $76,168 | $3,284 | $72,884 |
| 2019 | $1,442 | $71,185 | $3,069 | $68,116 |
| 2018 | $1,423 | $71,185 | $3,069 | $68,116 |
| 2017 | $1,439 | $71,185 | $3,069 | $68,116 |
| 2016 | $1,392 | $71,185 | $3,069 | $68,116 |
| 2015 | $1,342 | $71,185 | $3,069 | $68,116 |
| 2014 | $1,272 | $61,527 | $4,092 | $57,435 |
Source: Public Records
Map
Nearby Homes
- 0000 34 Hwy
- 0000 Hobcheidt Rd
- 2204 Splitt Dr
- 307 N Park Ave
- 2166 E Lake Dr
- 619 House St
- 515 Nance St
- 4201 Bull Frog Bay Dr
- Lot 13, E Park St
- Lot 12, E Park St
- Lot 11, E Park St
- Lot 9, E Park St
- Lot 10, E Park St
- Lot 8, E Park St
- Lot 7, E Park St
- Lot 6, E Park St
- Lot 5, E Park St
- Lot 4, E Park St
- Lot 3, E Park St
- Lot 2, E Park St