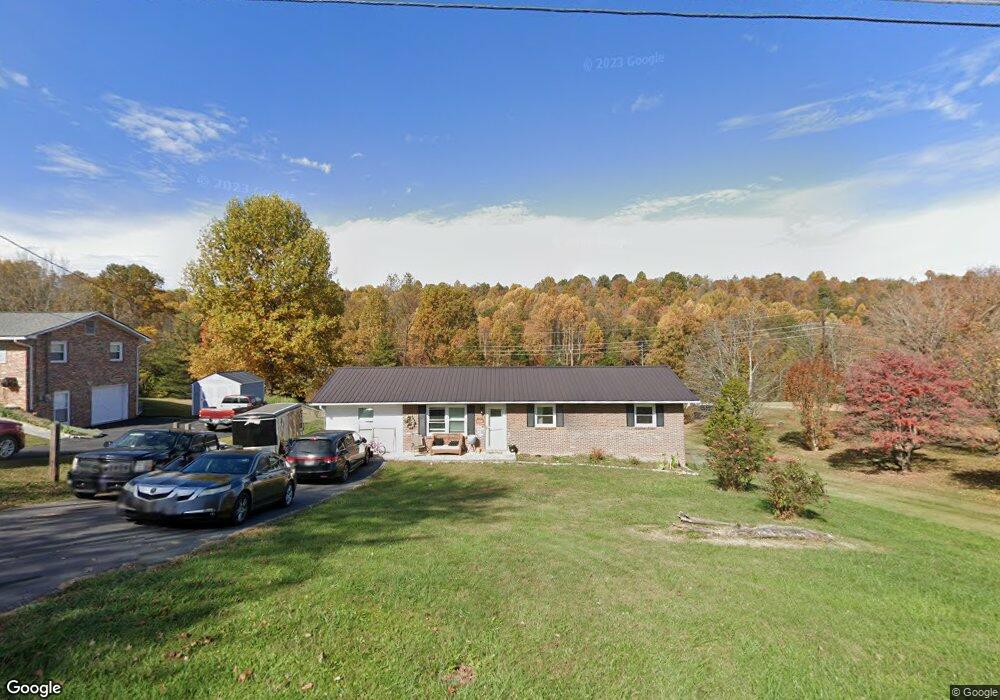
413 McCarty Hollow Rd Unit 1 Telford, TN 37690
Telford NeighborhoodEstimated Value: $160,000 - $271,063
3
Beds
1
Bath
1,172
Sq Ft
$194/Sq Ft
Est. Value
About This Home
This home is located at 413 McCarty Hollow Rd Unit 1, Telford, TN 37690 and is currently estimated at $227,266, approximately $193 per square foot. 413 McCarty Hollow Rd Unit 1 is a home located in Washington County with nearby schools including Grandview Elementary School and David Crockett High School.
Ownership History
Date
Name
Owned For
Owner Type
Purchase Details
Closed on
Jul 7, 2014
Sold by
Williams Renda
Bought by
Holley Amanda D
Current Estimated Value
Home Financials for this Owner
Home Financials are based on the most recent Mortgage that was taken out on this home.
Original Mortgage
$122,448
Outstanding Balance
$93,408
Interest Rate
4.2%
Mortgage Type
New Conventional
Estimated Equity
$133,858
Purchase Details
Closed on
Mar 3, 2010
Sold by
Deutsche Bank National Tru
Bought by
Williams Renda
Purchase Details
Closed on
Jul 23, 2009
Sold by
Street Myra N
Bought by
Deutsche Bank National C
Purchase Details
Closed on
May 6, 2002
Sold by
Cash Larry T
Bought by
Cash Myra N
Home Financials for this Owner
Home Financials are based on the most recent Mortgage that was taken out on this home.
Original Mortgage
$49,600
Interest Rate
7.12%
Purchase Details
Closed on
Jan 1, 1982
Bought by
Cash Larry T and Cash Myra
Create a Home Valuation Report for This Property
The Home Valuation Report is an in-depth analysis detailing your home's value as well as a comparison with similar homes in the area
Home Values in the Area
Average Home Value in this Area
Purchase History
| Date | Buyer | Sale Price | Title Company |
|---|---|---|---|
| Holley Amanda D | $120,000 | -- | |
| Williams Renda | $48,000 | -- | |
| Deutsche Bank National C | $88,268 | -- | |
| Cash Myra N | -- | -- | |
| Cash Larry T | $33,500 | -- |
Source: Public Records
Mortgage History
| Date | Status | Borrower | Loan Amount |
|---|---|---|---|
| Open | Holley Amanda D | $122,448 | |
| Previous Owner | Cash Larry T | $49,600 |
Source: Public Records
Tax History Compared to Growth
Tax History
| Year | Tax Paid | Tax Assessment Tax Assessment Total Assessment is a certain percentage of the fair market value that is determined by local assessors to be the total taxable value of land and additions on the property. | Land | Improvement |
|---|---|---|---|---|
| 2024 | $750 | $43,850 | $4,325 | $39,525 |
| 2022 | $535 | $24,900 | $3,950 | $20,950 |
| 2021 | $535 | $24,900 | $3,950 | $20,950 |
| 2020 | $535 | $24,900 | $3,950 | $20,950 |
| 2019 | $523 | $24,900 | $3,950 | $20,950 |
| 2018 | $523 | $21,975 | $3,950 | $18,025 |
| 2017 | $523 | $21,975 | $3,950 | $18,025 |
| 2016 | $523 | $21,975 | $3,950 | $18,025 |
| 2015 | $435 | $21,975 | $3,950 | $18,025 |
| 2014 | $435 | $21,975 | $3,950 | $18,025 |
Source: Public Records
Map
Nearby Homes
- 210 Telford Rd
- 283 Telford Rd
- 331 Telford Rd
- 1488 Old State Route 34
- 1496 Old State Route 34
- 394 Telford Rd
- 138 Berry Ridge Rd
- 000 Saults Rd
- 299 Stockyard Rd
- 158 Slate Hill Rd
- 169 Paynetown Rd
- 312 Stockyard Rd
- 205 Clyde Miller Dr
- 292 Leesburg Rd
- 186 Creasey Creek Rd
- 214 Telford New Victory Rd
- 110 Polo Ln
- 313 Rambling Rd
- TBD Leesburg
- 364 Berry Ridge Rd
- 413 McCarty Hollow Rd
- 419 McCarty Hollow Rd
- 421 McCarty Hollow Rd
- 409 McCarty Hollow Rd
- 414 McCarty Hollow Rd
- 425 McCarty Hollow Rd
- 410 McCarty Hollow Rd
- 422 McCarty Hollow Rd
- 431 McCarty Hollow Rd
- 433 McCarty Hollow Rd
- 396 McCarty Hollow Rd
- 399 McCarty Hollow Rd
- 435 McCarty Hollow Rd
- 392 McCarty Hollow Rd
- 234 Telford Rd
- 388 McCarty Hollow Rd
- 244 Telford Rd
- 437 McCarty Hollow Rd
- 402 McCarty Hollow Rd
- 228 Telford Rd