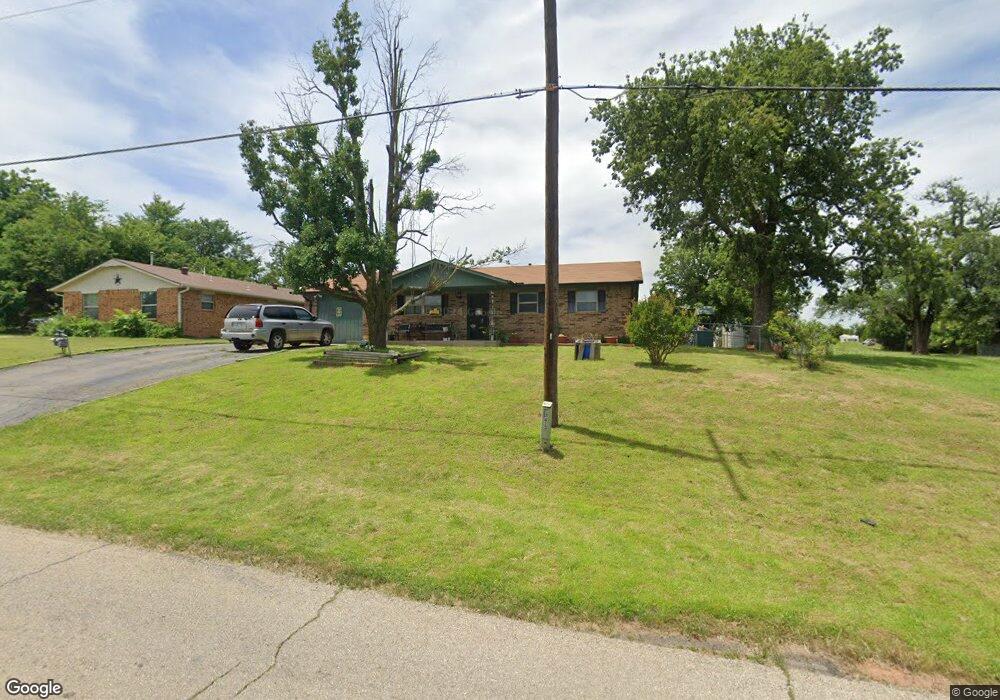
413 N Kings Hwy Cushing, OK 74023
Estimated Value: $127,000 - $143,345
3
Beds
3
Baths
1,428
Sq Ft
$95/Sq Ft
Est. Value
About This Home
This home is located at 413 N Kings Hwy, Cushing, OK 74023 and is currently estimated at $135,336, approximately $94 per square foot. 413 N Kings Hwy is a home located in Payne County with nearby schools including Cushing Upper Elementary School, Cushing Lower Elementary School, and Cushing High School.
Ownership History
Date
Name
Owned For
Owner Type
Purchase Details
Closed on
Nov 7, 2011
Sold by
Spencer Richard G and Spencer Patricia K
Bought by
Speucer Richard G
Current Estimated Value
Purchase Details
Closed on
Nov 8, 2007
Sold by
White Lavon and White Anita Faye
Bought by
Spencer Richard G and Spencer Patricia K
Home Financials for this Owner
Home Financials are based on the most recent Mortgage that was taken out on this home.
Original Mortgage
$73,000
Interest Rate
6.42%
Mortgage Type
VA
Purchase Details
Closed on
Apr 27, 2005
Sold by
Gaskins Joe E and Gaskins Michelle K
Bought by
White Lavon and White Anita F
Create a Home Valuation Report for This Property
The Home Valuation Report is an in-depth analysis detailing your home's value as well as a comparison with similar homes in the area
Home Values in the Area
Average Home Value in this Area
Purchase History
| Date | Buyer | Sale Price | Title Company |
|---|---|---|---|
| Speucer Richard G | -- | None Available | |
| Spencer Richard G | $73,000 | None Available | |
| White Lavon | $61,000 | None Available |
Source: Public Records
Mortgage History
| Date | Status | Borrower | Loan Amount |
|---|---|---|---|
| Previous Owner | Spencer Richard G | $73,000 |
Source: Public Records
Tax History Compared to Growth
Tax History
| Year | Tax Paid | Tax Assessment Tax Assessment Total Assessment is a certain percentage of the fair market value that is determined by local assessors to be the total taxable value of land and additions on the property. | Land | Improvement |
|---|---|---|---|---|
| 2025 | $1,129 | $12,728 | $560 | $12,168 |
| 2024 | $1,027 | $12,122 | $505 | $11,617 |
| 2023 | $1,027 | $11,544 | $510 | $11,034 |
| 2022 | $937 | $10,995 | $568 | $10,427 |
| 2021 | $869 | $10,471 | $583 | $9,888 |
| 2020 | $817 | $9,973 | $613 | $9,360 |
| 2019 | $897 | $10,480 | $613 | $9,867 |
| 2018 | $869 | $10,480 | $613 | $9,867 |
| 2017 | $863 | $10,480 | $613 | $9,867 |
| 2016 | $886 | $10,480 | $613 | $9,867 |
| 2015 | $743 | $8,578 | $499 | $8,079 |
| 2014 | $540 | $8,578 | $499 | $8,079 |
Source: Public Records
Map
Nearby Homes
- 0 W Cherry St
- 217 W Maple St
- 301 W Greenlee St
- 620 N Central Ave
- 1019 N Central Ave
- 228 S Central Ave
- 103 E Cherry St
- 0 N Noble Ave
- 711 N Steele Ave
- 1716 W 9th St
- 305 S Noble Ave
- 512 E Broadway St
- 723 E Maple St
- 708 E Broadway St
- 724 E Moses St
- 802 E Maple St
- 413 E 8th St
- 847 E Moses St
- 811 Parkview Dr
- 904 Parkview Dr
- 411 N Kings Hwy
- 503 N Kings Hwy
- 409 N Kings Hwy
- 424 N Kings Hwy
- 401 N Kings Hwy
- 1042 W Walnut St
- 1124 W Maple St
- 323 N Kings Hwy
- 1026 W Walnut St
- 423 N Hartman Ave
- 1123 W Maple St
- 315 N Kings Hwy
- 1122 W Maple St
- 313 N Kings Hwy
- 1122 W Oak St
- 1124 W Main Place
- 1025 W Main Place
- 1122 W Main Place
- 1006 W Maple St
- 303 N Kings Hwy