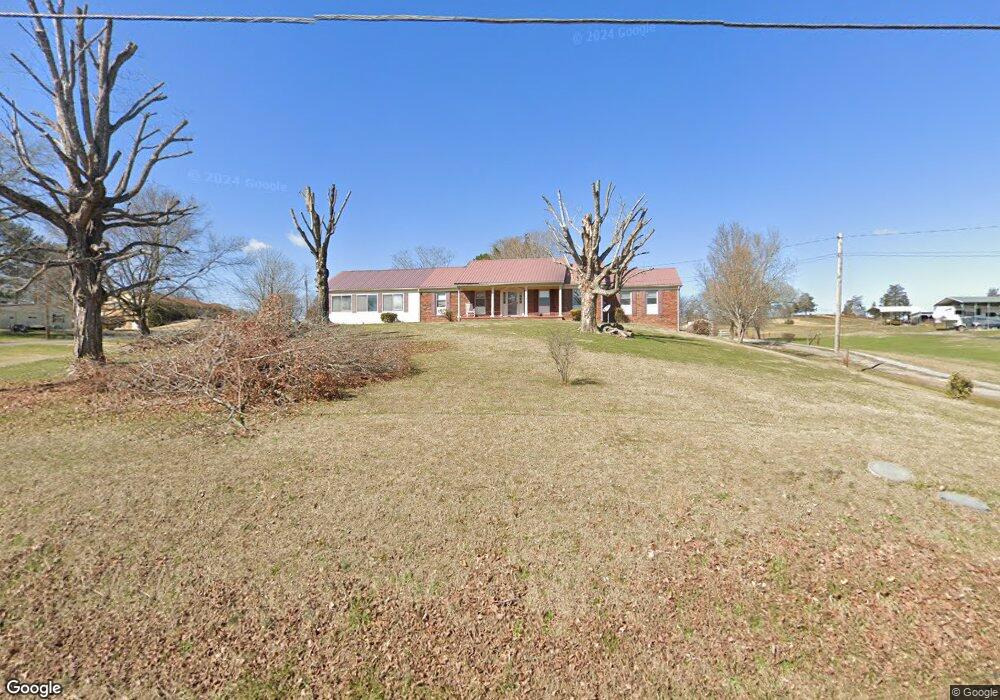
413 N Main St Bulls Gap, TN 37711
Estimated Value: $245,000 - $396,000
3
Beds
2
Baths
1,300
Sq Ft
$261/Sq Ft
Est. Value
About This Home
This home is located at 413 N Main St, Bulls Gap, TN 37711 and is currently estimated at $338,748, approximately $260 per square foot. 413 N Main St is a home located in Hawkins County with nearby schools including Bulls Gap School and Cherokee High School.
Ownership History
Date
Name
Owned For
Owner Type
Purchase Details
Closed on
Oct 29, 2015
Sold by
Jones Douglas F
Bought by
Clark Jimmy C and Justice Rebecca Sue
Current Estimated Value
Purchase Details
Closed on
Oct 21, 1998
Bought by
Jones Douglas F and Jones Pansy H
Purchase Details
Closed on
Oct 21, 1996
Sold by
Homer Stewart
Bought by
Neal Horner
Purchase Details
Closed on
Apr 27, 1965
Purchase Details
Closed on
Jul 2, 1947
Bought by
Price James J and Price Blanche
Create a Home Valuation Report for This Property
The Home Valuation Report is an in-depth analysis detailing your home's value as well as a comparison with similar homes in the area
Home Values in the Area
Average Home Value in this Area
Purchase History
| Date | Buyer | Sale Price | Title Company |
|---|---|---|---|
| Clark Jimmy C | $185,000 | -- | |
| Jones Douglas F | $75,000 | -- | |
| Neal Horner | $20,000 | -- | |
| -- | -- | -- | |
| Price James J | -- | -- |
Source: Public Records
Tax History Compared to Growth
Tax History
| Year | Tax Paid | Tax Assessment Tax Assessment Total Assessment is a certain percentage of the fair market value that is determined by local assessors to be the total taxable value of land and additions on the property. | Land | Improvement |
|---|---|---|---|---|
| 2024 | $1,391 | $54,450 | $5,525 | $48,925 |
| 2023 | $1,266 | $54,450 | $0 | $0 |
| 2022 | $1,621 | $54,450 | $5,525 | $48,925 |
| 2021 | $1,537 | $54,450 | $5,525 | $48,925 |
| 2020 | $1,428 | $54,450 | $5,525 | $48,925 |
| 2019 | $1,428 | $43,925 | $5,025 | $38,900 |
| 2018 | $1,419 | $43,925 | $5,025 | $38,900 |
| 2017 | $1,419 | $43,925 | $5,025 | $38,900 |
| 2016 | $1,411 | $43,925 | $5,025 | $38,900 |
| 2015 | $1,381 | $43,925 | $5,025 | $38,900 |
| 2014 | $1,550 | $49,600 | $5,025 | $44,575 |
Source: Public Records
Map
Nearby Homes
- 116 Magnolia Ave
- 123 N Main St
- 2.79 Ac U S 11e
- 711 N Main St
- 202 S Shepherd Dr
- 350 N Vfw Rd
- 0 Whitehorn Rd Unit 1314385
- 438 N Vfw Rd
- 473 Lautner Rd
- 945 N Main St
- 204 Meadowview Rd
- Tbd Stone Mountain Rd
- 15 Stone Mountain Rd
- 670 Bulls Gap Saint Clair Rd
- 415 Stone Mountain Rd
- 670 Bulls Gap-Saint Clair Rd
- 415 Pleasant Hill Rd
- 7 W Andrew Johnson Hwy
- 0 Guthries Gap Rd Unit 611585
- 231 Guthries Gap Rd