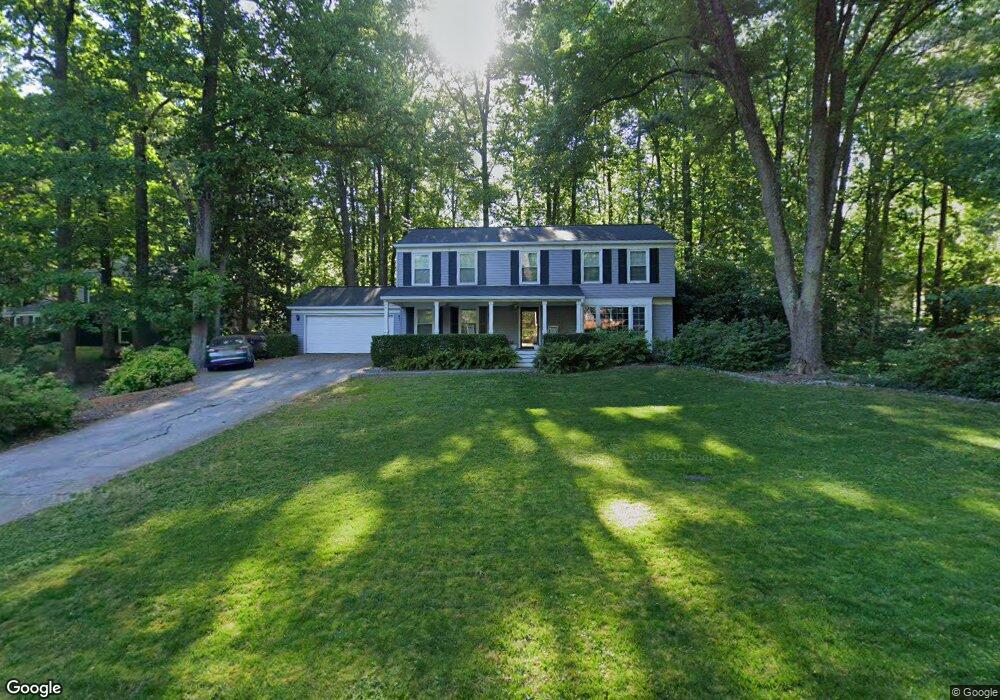
413 Pebblestone Ct SE Unit 6 Marietta, GA 30067
East Cobb NeighborhoodEstimated Value: $596,000 - $646,000
4
Beds
3
Baths
2,482
Sq Ft
$249/Sq Ft
Est. Value
About This Home
This home is located at 413 Pebblestone Ct SE Unit 6, Marietta, GA 30067 and is currently estimated at $617,282, approximately $248 per square foot. 413 Pebblestone Ct SE Unit 6 is a home located in Cobb County with nearby schools including Sope Creek Elementary School, East Cobb Middle School, and Wheeler High School.
Ownership History
Date
Name
Owned For
Owner Type
Purchase Details
Closed on
Sep 27, 2001
Sold by
Petenbrink Barry L and Petenbrink Nancy G
Bought by
Bonds Charles C
Current Estimated Value
Home Financials for this Owner
Home Financials are based on the most recent Mortgage that was taken out on this home.
Original Mortgage
$187,600
Outstanding Balance
$72,514
Interest Rate
6.87%
Mortgage Type
New Conventional
Estimated Equity
$544,768
Purchase Details
Closed on
Apr 6, 1993
Sold by
Blauser Russell G
Bought by
Whiton Clara S
Home Financials for this Owner
Home Financials are based on the most recent Mortgage that was taken out on this home.
Original Mortgage
$95,000
Interest Rate
7.56%
Create a Home Valuation Report for This Property
The Home Valuation Report is an in-depth analysis detailing your home's value as well as a comparison with similar homes in the area
Home Values in the Area
Average Home Value in this Area
Purchase History
| Date | Buyer | Sale Price | Title Company |
|---|---|---|---|
| Bonds Charles C | $234,500 | -- | |
| Whiton Clara S | $65,000 | -- |
Source: Public Records
Mortgage History
| Date | Status | Borrower | Loan Amount |
|---|---|---|---|
| Open | Bonds Charles C | $187,600 | |
| Previous Owner | Whiton Clara S | $95,000 |
Source: Public Records
Tax History Compared to Growth
Tax History
| Year | Tax Paid | Tax Assessment Tax Assessment Total Assessment is a certain percentage of the fair market value that is determined by local assessors to be the total taxable value of land and additions on the property. | Land | Improvement |
|---|---|---|---|---|
| 2025 | $4,995 | $210,020 | $60,000 | $150,020 |
| 2024 | $4,984 | $209,308 | $44,000 | $165,308 |
| 2023 | $3,547 | $168,060 | $32,000 | $136,060 |
| 2022 | $3,682 | $148,028 | $32,000 | $116,028 |
| 2021 | $3,525 | $140,828 | $32,000 | $108,828 |
| 2020 | $3,048 | $119,068 | $32,000 | $87,068 |
| 2019 | $3,048 | $119,068 | $32,000 | $87,068 |
| 2018 | $2,986 | $116,196 | $22,000 | $94,196 |
| 2017 | $2,870 | $116,196 | $22,000 | $94,196 |
| 2016 | $2,683 | $107,544 | $22,000 | $85,544 |
| 2015 | $2,745 | $107,544 | $22,000 | $85,544 |
| 2014 | $2,720 | $105,560 | $0 | $0 |
Source: Public Records
Map
Nearby Homes
- 420 Huntsman Way SE
- 253 Lamplighter Ln SE
- 220 Lamplighter Ct SE
- 3863 Streamside Dr SE
- 3695 Fox Hills Dr SE
- 139 Shadowlake Ln SE
- 4010 Paper Mill Rd SE
- 79 Pheasant Dr SE
- 16 Ancient Oak Ct NE
- 3365 Turtle Lake Dr SE
- 104 Shareese Ct SE
- 4161 Thunderbird Dr SE
- 50 Old Fuller Mill Rd NE
- 33 Old Stonemill Rd NE Unit 1
- 4116 River Cliff Chase SE
- 208 Indian Hills Trail
- 560 Park Ln SE
- 3511 Brookview Dr
- 3940 Riverlook Pkwy SE Unit 103
- 770 Old Paper Mill Dr SE
- 407 Pebblestone Ct SE
- 301 Lamplighter Ln SE
- 305 Lamplighter Ln SE
- 410 Huntsman Way SE
- 412 Pebblestone Ct SE
- 422 Pebblestone Ct SE
- 405 Pebblestone Ct SE
- 406 Pebblestone Ct SE
- 408 Pebblestone Ct SE
- 302 Lamplighter Ln SE
- 402 Huntsman Way SE
- 306 Lamplighter Ln SE
- 404 Pebblestone Ct SE
- 298 Lamplighter Ln SE Unit 4
- 392 Huntsman Way SE
- 421 Huntsman Way SE
- 310 Lamplighter Ln SE
- 411 Huntsman Way SE Unit 6
- 294 Lamplighter Ln SE
- 401 Huntsman Way SE