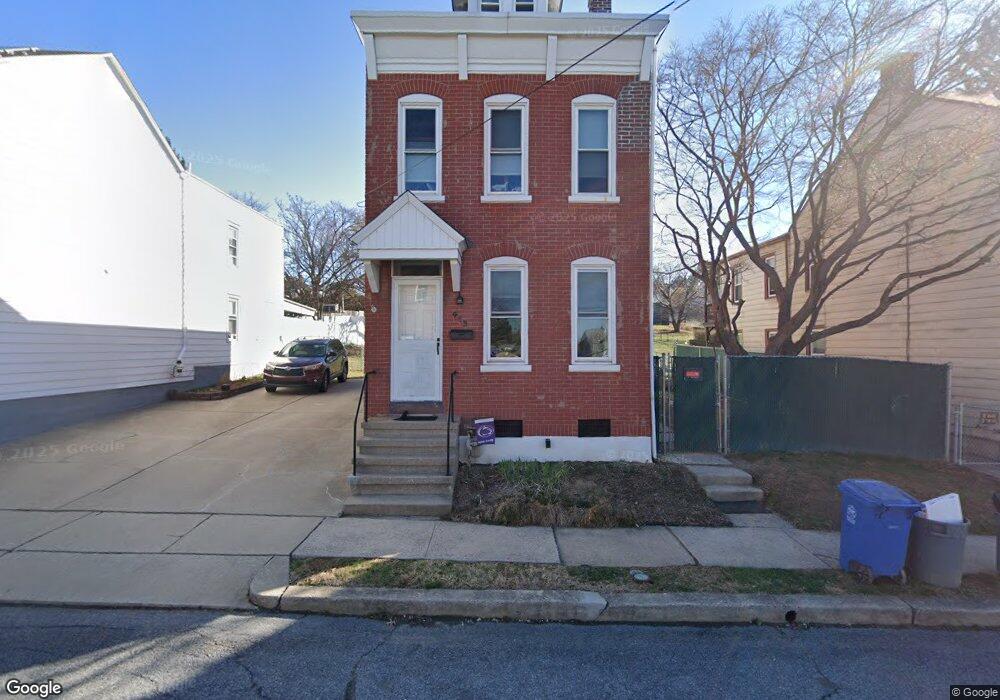
413 Pennsylvania Ave Muhlenberg Township, PA 19605
Hyde Park-Muhlenberg NeighborhoodEstimated Value: $243,000 - $330,000
3
Beds
2
Baths
1,697
Sq Ft
$163/Sq Ft
Est. Value
About This Home
This home is located at 413 Pennsylvania Ave, Muhlenberg Township, PA 19605 and is currently estimated at $276,467, approximately $162 per square foot. 413 Pennsylvania Ave is a home located in Berks County with nearby schools including Muhlenberg Elementary Center, C E Cole Intermediate School, and Muhlenberg Junior High School.
Ownership History
Date
Name
Owned For
Owner Type
Purchase Details
Closed on
Apr 30, 2010
Sold by
Reis Jennifer L
Bought by
Wyland Jennifer Reis and Wyland Sean J
Current Estimated Value
Purchase Details
Closed on
Jun 30, 2008
Sold by
Koons Ryan A and Koons Rachel G
Bought by
Reis Jennifer L
Home Financials for this Owner
Home Financials are based on the most recent Mortgage that was taken out on this home.
Original Mortgage
$138,803
Outstanding Balance
$89,273
Interest Rate
6.01%
Mortgage Type
FHA
Estimated Equity
$187,194
Purchase Details
Closed on
Aug 17, 2004
Sold by
Fusner Gerald and Fusner Joyce M
Bought by
Koons Ryan A and Koons Rachel G
Home Financials for this Owner
Home Financials are based on the most recent Mortgage that was taken out on this home.
Original Mortgage
$79,900
Interest Rate
6.01%
Mortgage Type
Purchase Money Mortgage
Create a Home Valuation Report for This Property
The Home Valuation Report is an in-depth analysis detailing your home's value as well as a comparison with similar homes in the area
Home Values in the Area
Average Home Value in this Area
Purchase History
| Date | Buyer | Sale Price | Title Company |
|---|---|---|---|
| Wyland Jennifer Reis | -- | None Available | |
| Reis Jennifer L | $139,900 | None Available | |
| Koons Ryan A | $79,900 | First American Title Ins Co |
Source: Public Records
Mortgage History
| Date | Status | Borrower | Loan Amount |
|---|---|---|---|
| Open | Reis Jennifer L | $138,803 | |
| Previous Owner | Koons Ryan A | $79,900 |
Source: Public Records
Tax History Compared to Growth
Tax History
| Year | Tax Paid | Tax Assessment Tax Assessment Total Assessment is a certain percentage of the fair market value that is determined by local assessors to be the total taxable value of land and additions on the property. | Land | Improvement |
|---|---|---|---|---|
| 2025 | $1,312 | $87,400 | $42,000 | $45,400 |
| 2024 | $4,208 | $87,400 | $42,000 | $45,400 |
| 2023 | $3,949 | $87,400 | $42,000 | $45,400 |
| 2022 | $3,884 | $87,400 | $42,000 | $45,400 |
| 2021 | $3,792 | $87,400 | $42,000 | $45,400 |
| 2020 | $3,792 | $87,400 | $42,000 | $45,400 |
| 2019 | $3,712 | $87,400 | $42,000 | $45,400 |
| 2018 | $3,646 | $87,400 | $42,000 | $45,400 |
| 2017 | $3,577 | $87,400 | $42,000 | $45,400 |
| 2016 | $1,060 | $87,400 | $42,000 | $45,400 |
| 2015 | $1,060 | $87,400 | $42,000 | $45,400 |
| 2014 | $1,060 | $87,400 | $42,000 | $45,400 |
Source: Public Records
Map
Nearby Homes
- 437 Jefferson St
- 2920 Kutztown Rd
- 11 Seminary Ave
- 3019 Kutztown Rd
- 411 Fairview St
- 518 Muhlenberg St
- 2260 Northmont Blvd
- 604 Belmont Ave
- 2308 Hoffer Ave
- 705 Alton Ave
- 3318 Fremont St
- 3408 Kutztown Rd
- 2024 Kutztown Rd
- 3416 Kutztown Rd
- 1016 Josephine Dr
- 3431 Fairfield St
- 3226 Montrose Ave
- 1106 E Bellevue Ave
- 3219 Marion St
- 3005 Garfield Ave
- 409 Pennsylvania Ave
- 417 Pennsylvania Ave
- 407 Pennsylvania Ave
- 425 Pennsylvania Ave
- 416 Pennsylvania Ave
- 12 Monroe St
- 412B Pennsylvania Ave
- 412 Pennsylvania Ave
- 420 Pennsylvania Ave
- 412A Pennsylvania Ave
- 427 Pennsylvania Ave
- 405 Pennsylvania Ave
- 422 Pennsylvania Ave
- 10 Monroe St
- 424 Pennsylvania Ave
- 414 Pennsylvania Ave
- 410 Pennsylvania Ave
- 426 Pennsylvania Ave
- 8 Monroe St
- 408 Pennsylvania Ave