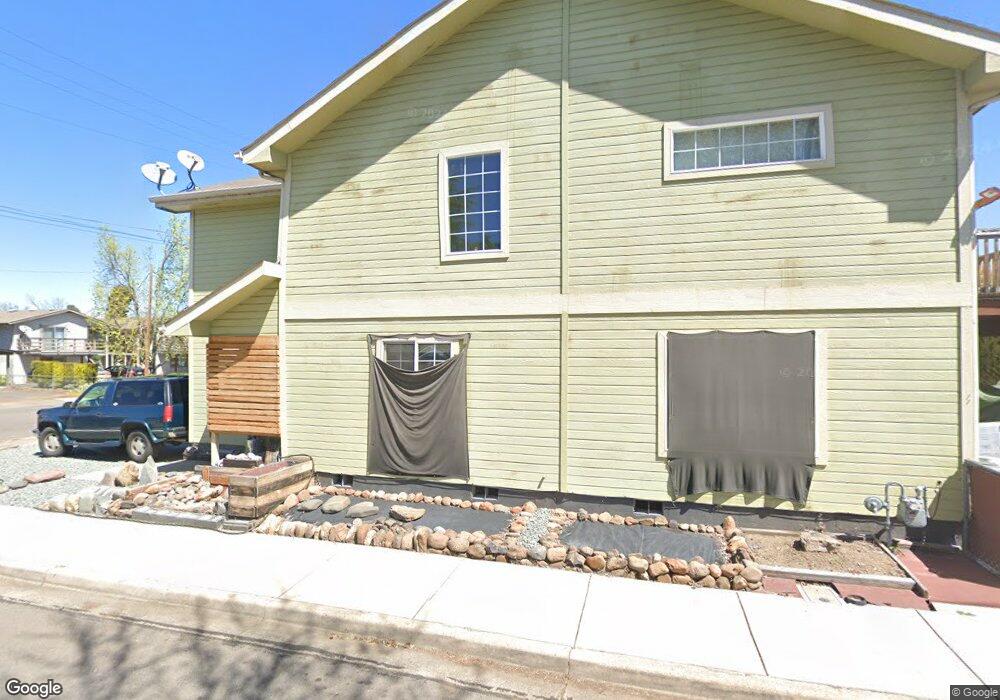
413 S 1st St Central Point, OR 97502
Estimated Value: $362,747 - $378,000
3
Beds
2
Baths
1,320
Sq Ft
$280/Sq Ft
Est. Value
About This Home
This home is located at 413 S 1st St, Central Point, OR 97502 and is currently estimated at $369,937, approximately $280 per square foot. 413 S 1st St is a home located in Jackson County with nearby schools including Central Point Elementary School, Scenic Middle School, and Crater High School.
Ownership History
Date
Name
Owned For
Owner Type
Purchase Details
Closed on
Jun 8, 2018
Sold by
Hulce Jason R
Bought by
Boles Jerred and Boles Amy
Current Estimated Value
Home Financials for this Owner
Home Financials are based on the most recent Mortgage that was taken out on this home.
Original Mortgage
$230,743
Outstanding Balance
$203,819
Interest Rate
5.5%
Mortgage Type
FHA
Estimated Equity
$166,118
Purchase Details
Closed on
May 26, 2006
Sold by
Hulce Jason R and Hulce Robin
Bought by
Hulce Jason R
Home Financials for this Owner
Home Financials are based on the most recent Mortgage that was taken out on this home.
Original Mortgage
$306,667
Interest Rate
7.12%
Mortgage Type
Construction
Purchase Details
Closed on
Jun 10, 2003
Sold by
Winkler Michael V
Bought by
Hulce Jason R and Hulce Robin
Home Financials for this Owner
Home Financials are based on the most recent Mortgage that was taken out on this home.
Original Mortgage
$86,750
Interest Rate
4%
Mortgage Type
Unknown
Create a Home Valuation Report for This Property
The Home Valuation Report is an in-depth analysis detailing your home's value as well as a comparison with similar homes in the area
Home Values in the Area
Average Home Value in this Area
Purchase History
| Date | Buyer | Sale Price | Title Company |
|---|---|---|---|
| Boles Jerred | $235,000 | First American Title | |
| Hulce Jason R | -- | Lawyers Title Ins | |
| Hulce Jason R | $96,400 | Lawyers Title Insurance Corp |
Source: Public Records
Mortgage History
| Date | Status | Borrower | Loan Amount |
|---|---|---|---|
| Open | Boles Jerred | $230,743 | |
| Previous Owner | Hulce Jason R | $306,667 | |
| Previous Owner | Hulce Jason R | $86,750 |
Source: Public Records
Tax History Compared to Growth
Tax History
| Year | Tax Paid | Tax Assessment Tax Assessment Total Assessment is a certain percentage of the fair market value that is determined by local assessors to be the total taxable value of land and additions on the property. | Land | Improvement |
|---|---|---|---|---|
| 2025 | $2,819 | $169,520 | $26,910 | $142,610 |
| 2024 | $2,819 | $164,590 | $26,130 | $138,460 |
| 2023 | $2,728 | $159,800 | $25,370 | $134,430 |
| 2022 | $2,664 | $159,800 | $25,370 | $134,430 |
| 2021 | $2,588 | $155,150 | $24,630 | $130,520 |
| 2020 | $2,513 | $150,640 | $23,920 | $126,720 |
| 2019 | $2,451 | $142,000 | $22,540 | $119,460 |
| 2018 | $2,348 | $272,110 | $78,120 | $193,990 |
| 2017 | $4,572 | $272,110 | $78,120 | $193,990 |
| 2016 | $4,439 | $256,500 | $73,630 | $182,870 |
| 2015 | $4,252 | $256,500 | $73,630 | $182,870 |
| 2014 | $4,144 | $241,780 | $69,410 | $172,370 |
Source: Public Records
Map
Nearby Homes
- 114 Cedar St
- 350 Alder St
- 531 Bush St
- 755 S 4th St
- 715 Ash St
- 840 Ash St
- 340 Freeman Rd
- 555 Freeman Rd Unit 128
- 555 Freeman Rd Unit 146
- 555 Freeman Rd Unit 204
- 555 Freeman Rd Unit 209
- 739 S Haskell St
- 349 W Pine St
- 144 N 5th St
- 546 Laurel St
- 3364 Snowy Butte Ln
- 887 Silver Fox Dr
- 571 Briarwood Dr
- 3496 Edella St
- 845 Manzanita St